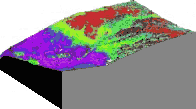
Now you are familiar with the broad patterns (including vegetation) over Sykes Moor from the air, it is useful to look at a 3D diagram of the area. It is colour-coded to show vegetation and other land cover types.
These were mapped from the HyMap image
The block diagram was produced using a digital elevation model.
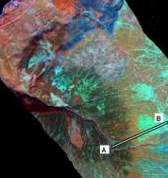
The diagram right shows the slope profile AB down the Y-lobe from WSW to NNE towards Torside Clough.
![]()
Vegetation types mapped from the HyMap image have been superimposed on the profile. The vegetation theme pages and the vegetation glossary give more information on the plants.
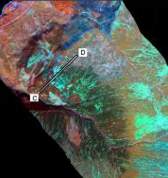
The second slope profile CD, shows a slightly different transition of land cover types with peat exposed at lower elevations.
![]()
The HyMap images used to map the vegetation profiles are shown left.
The block diagram right shows the location of profile CD and distribution of land cover.
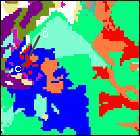
For comparison, this image shows a section of a habitat map produced from aerial photos. The location of profile CD is marked for reference.
Image courtesy of FRCA/RDS.
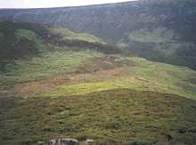
Vegetation transitions can also be seen on a ground photograph.
The vegetation themes pages will elaborate on the issues raised here. Links to the vegetation glossary will help you understand more about the specific plant species and why they are found in certain places.
> Next site: 6. Sykes Moor Weather Station.
< Previous site: 6. Sykes Moor - from ground, air and space.
< Start of tour.
