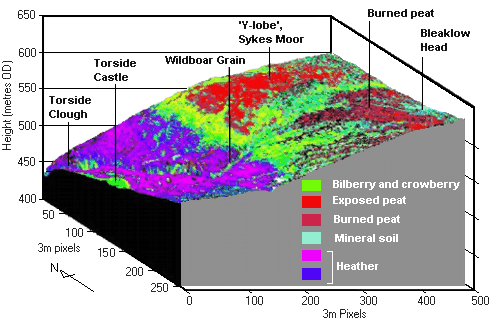
Digital elevation model and HyMap image used to classify the vegetation, both courtesy of BNSC and NERC for the SHAC campaign.
The diagram shows how land cover changes downslope from Sykes Moor across the large area of exposed peat known as the 'Y-lobe', towards Torside Clough.

- Exposed peat occurs above about 540m.
- It is surrounded by bilberry and crowberry which like the drier conditions associated with eroding peat.
- Heather clings to the slopes of Torside Clough.
- Torside Castle is a hummock of grassland (although it is mapped here as bilberry), surrounded by heather. It is a prehistoric site which would have served as a good vantage point.