| Census | Topology | Info Maps | Info Landscapes | Info Spaces | ISP Maps |
| Wireless | Web Site Maps | Surf Maps | MUDs & Virtual Worlds | Historical |
|
Sorry, the Cybergeography Research web pages are no longer being updated. The project ran from 1997-2004, but my research has moved away into other areas (see my blog for latest). If you have any questions or comments, please email me at: m.dodge (at) manchester.ac.uk. Cheers, Martin Dodge, February 2007. |

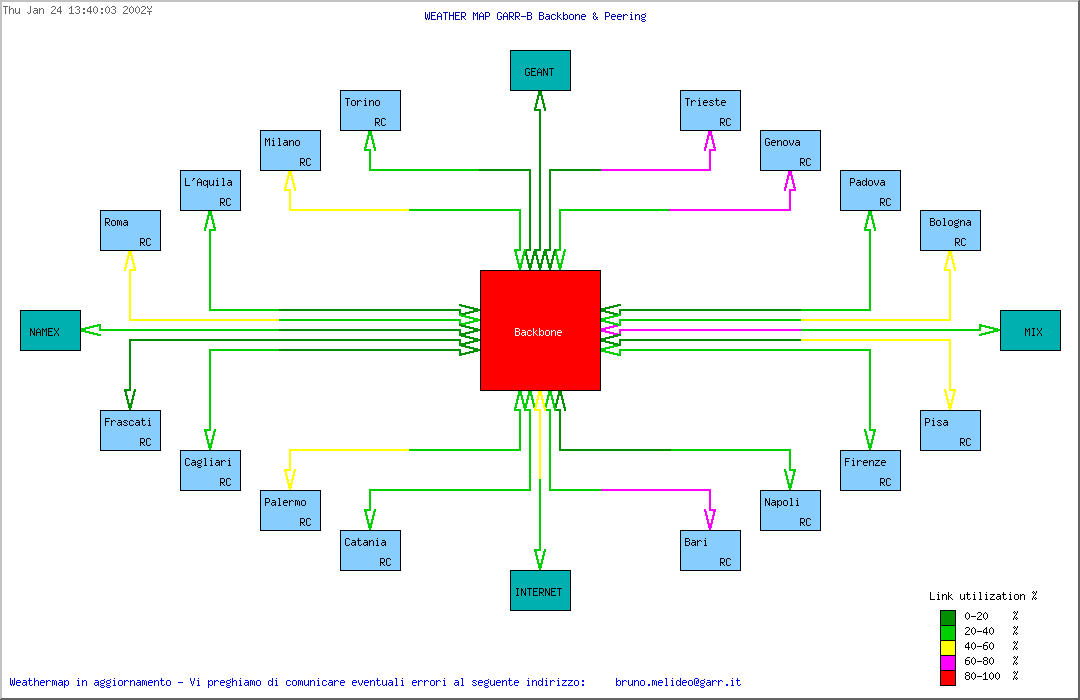
| These maps provide snaps shot views of network performance and traffic flows in near real-time. They often these maps also act as an interface for users to acess more detailed statistics by clicking on a link or node. |
![]()
 |
|
|
![]()
|
This is a real-time weather map of the Abilene network produced by Network Operations Center at Indiana University. The Abilene network is part of the Internet2 project linking US universities with a very fast, high-capacity network |
 |
![]()
 |
![]()
 |
 |
|
These are dynamic network weather maps
of the backbone of Uninett,
serving the education and research sector in Norway. The maps show the
network capacity by line thickness and daily traffic load by line
colour at different geographic scales.
|
|
![]()
|
Here is another nice example of
a weather map which presents network load using a topology diagram.
The diagram shows the performance on the NORDUnet network, which is the research and education network connecting Denmark, Finland, Iceland, Norway and Sweden. |
![]()
 |
Clicking on individual link arrows brings up more
detailed traffic graphs. |
![]()
|
Matrix NetSystems
produces an animated map called the Internet Weather
Report (IWR), which dynamically maps the condition of the
Internet measured by timing network latencies six times a day from
their HQ in Texas to over four thousand domains around the world. Shown
below are three frames from an IWR of East Asia. To fully appreciate
the dynamic nature of IWR, see the animated maps in action.
|
|
Matrix NetSystems
also produces a wide range of real-time Internet performance statistics
in its Internet Ratings
and Internet
Average services.
|
![]()
|
For more information on these types of maps see the Mappa.Mundi Magazine article "Mostly Cloudy, Clearing Later: Network Weather Maps", from December 2001. Also couple of short articles from a few years ago on the usefulness of these real-time Internet monitors - "Net Forecast: Cloudy, but Clearing" and "Are Net Weather Reports A Snow Job?". For more resources check out interesting web sites for Internet monitoring, maintained by Les Cottrell. |
![]()
| Introduction | Whats New | Conceptual | Artistic | Geographic | Cables & Satellites | Traceroutes |
| Census | Topology | Info Maps | Info Landscapes | Info Spaces | ISP Maps | ![]() Weather Maps
|
Weather Maps
|
| Wireless | Web Site Maps | Surf Maps | MUDs & Virtual Worlds
| Historical |
Want to know
more?
Why not check out the new book of the Atlas

|
Sorry, the Cybergeography Research web pages are no longer being updated. The project ran from 1997-2004, but my research has moved away into other areas (see my blog for latest). If you have any questions or comments, please email me at: m.dodge (at) manchester.ac.uk. Cheers, Martin Dodge, February 2007. |