| Census | Topology | Info Maps | Info Landscapes |
| Wireless | Web Site Maps | Surf Maps | MUDs & Virtual Worlds | Historical |

Three dimensional virtual spaces are being used to map information for easy exploration and navigation.
|
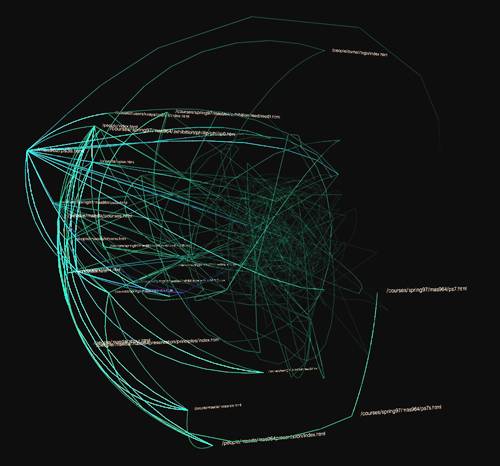
A ghostly information visualisation of traffic through
a Web site called Valence. It was created by Ben
Fry, as part of his research into organic information design in
the Aesthetics and Computation Group at the MIT Media Lab.
|
|
[For more information you may like to read the Map
of the Month article "Mapping
how people use a website" at Mappa.Mundi Magazine.]
|
![]()
| The image above is a VISVIP
visualisation of a user path through a Web site. It was developed by John
Cugini and colleagues in the Visualization and Virtual Reality Group
at the National Institute of Standards and Technology, USA.
The user's path through the site is shown by the curving yellow line overlaid on the site structure. The length of time spent at each page is represented by the height of dotted line projecting up from the graph. |
![]()
|
The WebTraffic project is developing prototype 3D visualisations of online behaviour. The project is lead by Antoine Visonneau, with colleagues in the Center for Design Informatics, Harvard Design School. Their current designs use VRML to visualise traffic within a website, with the vertical gray bars being individual pages and the red lines. |
![]()
|
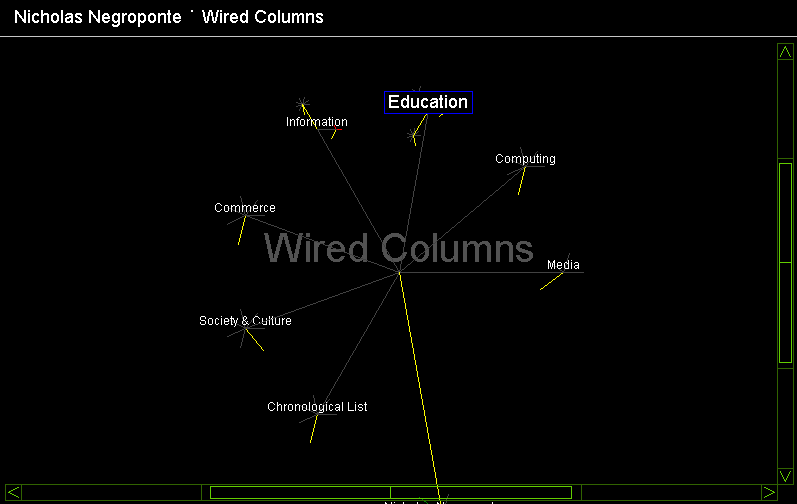
The information visualisation and navigation tool called PerspectaView was developed by Perspecta. Their information space was created using the SmartContent System. [Perspecta is no longer in business] |
|
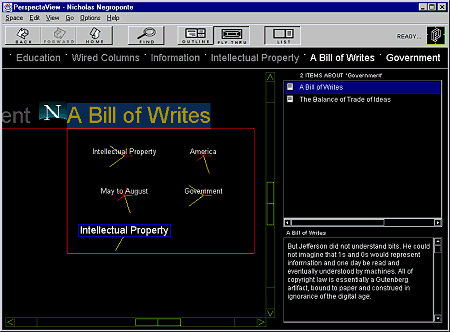
Visualising information spaces using Apple's Meta Content Format (MCF). The Hotsauce plug-in allows you to fly thru the information. It was developed by R.V.Guha. [For more information on HotSauce, you may like to read the Map of the Month article "Fly Through the Web" at Mappa.Mundi Magazine.] |
![]()
|
cospace
was an experimental 3D shared environment for browsing the Web. In
cospace Web surfers are represented as avatars and can communicate
with each other. It was developed by Thomas Kirk and Peter Selfridge
at AT&T Labs.
|
|
![]()
|
|
![]()
|
The computer processes are represented by individual monsters which you can kill! |
|
![]()
|
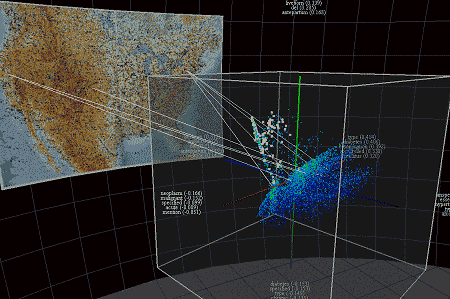
The Starlight visual information analysis environment developed by John Risch and researchers at the Pacific Northwest National Laboratory. The system provide an immersive, fully 3D environment to display and analyse complex multimedia information collections and it was originally developed for US intelligence. |
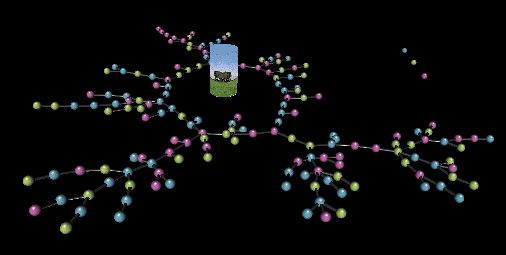
| A "semantic constellation" of an information space. The balls represent documents and their spatial arrangement shows relationships between them. It was produced by Chaomei Chen, Department of Information Systems and Computing, Brunel University. |
|
More details are given in their CHI paper, "The WebBook and the Web Forager: An Information Workspace for the World-Wide Web". |
![]()
|
UBUBU is a
visual bookmarking tool for the Web using the spatial metaphor of
icons on a three-dimensional planet.
|