| Census | Topology |
| Wireless | Web Site Maps | Surf Maps | MUDs & Virtual Worlds | Historical |
|
Sorry, the Cybergeography Research web pages are no longer being updated. The project ran from 1997-2004, but my research has moved away into other areas (see my blog for latest). If you have any questions or comments, please email me at: m.dodge (at) manchester.ac.uk. Cheers, Martin Dodge, February 2007. |
| These example cybermaps represent Cyberspaces as two dimensional maps. They can be seen as analogous to conventional landuse maps used in city planning. Often sophisticated information indexing and classification methods are employed to produce these maps. The aim of these maps is to provide a sense of the "lie of the land" of an information domain to aid browsing and document retrieval. |
![]()
 |
 |
|
Two innovative visualisations
of conversations on web-based chat boards developed by Rebecca Xiong as
part of her graduate research at MIT Media Lab. The example on the left
is called PeopleGarden and the one on the right is WebFan. Further
details are given here: : Xiong R. and Donath J. (1999), "PeopleGarden:
Creating data portraits for users", UIST.
|
|
![]()
 |
 |
|
Two examples of the multi-level information maps from Map.Net which enable you to browse over 2 million websites from the Open Directory. Each coloured tile in the map represents a category of websites, with high profile individual ones shown by the target symbols. The Map.Net system also used to include a 3D cityscape view of the Web shown on the information landscapes page The underlying information mapping technology is called Visual Net and is being developed by Antarcti.ca. |
|
![]()
|
Eastgate's Storyspace
is a leading tool for writing hypertexts. It includes a number of
different maps views of the hypertext structure to help the authors
develop their stories.
|
 |
![]()
 |
Conversation Map, developed by Warren Sack. It is a browser designed to make it easier for participants to understand and reflect on very large-scale virtual conversations like mailing lists or Usenet newsgroups. In this example screenshot, Conversation Map is visualising a weeks worth of messages posted to the Usenet newsgroup ALT.TV.X-FILES. |
![]()
| Trail maps of the web browsing paths produced by ten weeks of surfing by Matthew Chalmers and colleagues. You can search the paths for relevant web pages, which are highlighted as black dots. See their paper "The Order of Things: Activity-Centred Information Access" for more information on their research. |
|
Map of the Market, from SmartMoney.com, maps the stock performance of 500 US corporation. Individual companies are represented by different plots of land sized according to their market capitalisation. The colour of the plot indicates recent changes in stock price. It was developed by Martin Wattenberg. [For more information see the Map of Month article, "Show Me The Money: The Map of the Market" in Mappa.Mundi Magazine, August 2001.] |

|
|
An example map from Luc Girardin's, The Graduate Institute of International Studies, Switzerland, "cyberspace geography visualization" system. |
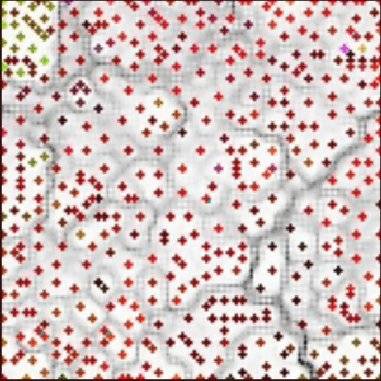
| This is a WEBSOM document map of a Usenet newsgroup produced by the Neural Networks Research Centre at the Helsinki University of Technology, Finland. | 
|
| This example is SiteMap developed by Xia Lin, Drexel University, maps part of the Web space relating to astronomy and space science as stored in the Yahoo directory. The hierarchical, text listing in Yahoo is transformed into landuse cybermap. |  |
![]()
 |
|
Lighthouse provides a visual interface to Web search engines. It was developed by Anton Leuski, a graduate student in the Computer Science Department at University of Massachusetts at Amherst. A demo version allowed you to visualise the results from major search engines such as Google and Excite. For more information see the technical paper, "Lighthouse: Showing the Way to Relevant Information", by Anton Leuski and James Allan, from the Proceedings of IEEE Symposium on Information Visualization 2000 (InfoVis 2000), Salt Lake City, Utah, October 9-10, 2000. |
![]()
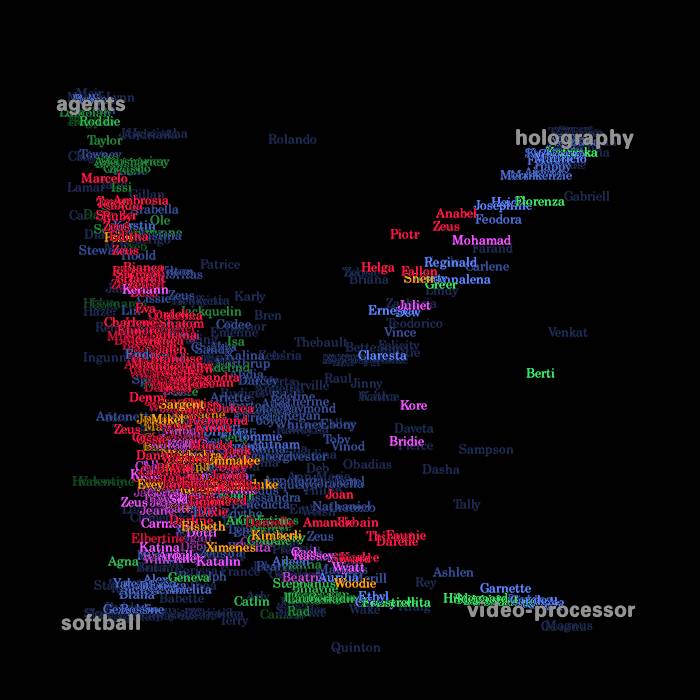
| "ET-Map"
- a multi-level category map of the information space of over 100,000
entertainment related Web pages listed by Yahoo!. ET-Map is one of a
number of information visualisation technique developed by
researchers,lead by Hsinchun Chen, at the Artificial Intelligence Lab,
University of Arizona, USA.
[For more information see the Map of Month article, "A Map of Yahoo!" in Mappa.Mundi Magazine.] |
|
![]()
 |
|
More information on Skupin's research is given here: Skupin A. and Fabrikant, S.I. (2003). "Spatialization Methods: A Cartographic Research Agenda for Non-Geographic Information Visualization", Cartography and Geographic Information Science, Vol. 30, No. 2, pages 95-119. |
![]()
| A map of the social patterns of an electronic community produced by Visual Who developed by Judith S. Donath, Media Lab, MIT, USA. |
| Further work on social visualisation is shown below.
These are images from Chat
Circles, an abstract visual interface to real-time
conversations on the Internet. It is being developed by Fernanda B.
Viégas and Judith Donath, Sociable Media Group,
MIT Media Lab. The colour, size and location of the circles are used to
visually represent the structure and dynamics of the conversations. The
image on the right show the representation of conversational histories.
You can try Chat Cirles from here.
See their paper on Chat Circles at CHI'99 for further information. |
 |
 |
|
These are information maps using astronomical metaphors to browse articles in the Rhizome artbase archive of Internet art. Individual articles are represented by stars, with their brightness in proportion to how popular they are. The example above is called StarryNight and was developed by Alex Galloway and Mark Tribe.
Shown opposite is the Spiral interface developed by Martin Wattenberg. More details on Wattenberg's work is available at mw2mw. |
 |
 |
![]()
|
An information map of global news stories from NewsMaps. The map summaries 121 online news reports from December 13th 1999. NewsMaps is powered by ThemeScape technology from Cartia. Cartia was acquired by Aurigin Systems, Inc. and, unfortunately, NewsMaps is no more. ThemeScape is still available. [For more information see the Map of Month article, "NewsMaps: Topographic Mapping of Information".] |
![]()
|
As part of the Netscan project at Microsoft Research this treemap tool provides a 2d space-filling visualisation of specified chunks of the USENET newsgroup hierarchy. This example shows the newsgroups from the rec.music hierarchy, with the size of each box showing the number of posts and colour indicating changing popularity of the group. The system was developed by Andrew Fiore and Marc Smith.
|
 |
| Further examples of Netscan's USENET visualisations are shown on the topology page of the Atlas. |
![]()
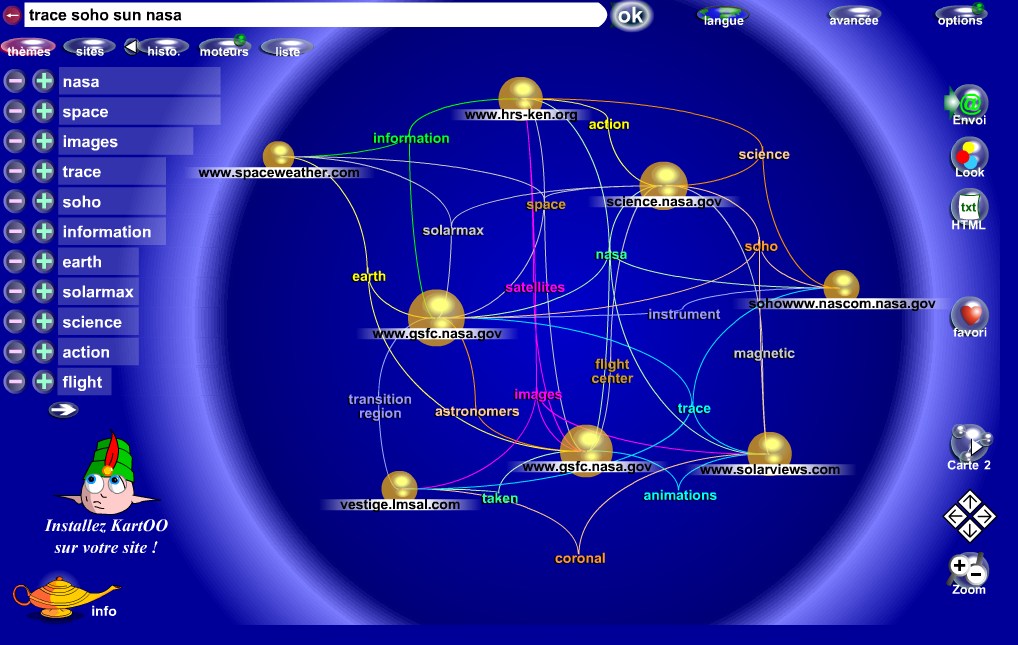 |
Kartoo - les cartes du web. An interesting network metaphor as a visual interface to search engine results. |
![]()
|
Websites can be indexed and mapped by geographic location. This example is the UK clickable map and provides a map directory of the websites of all universities and colleges in the United Kingdom. It is maintained by Peter Burden at the University of Wolverhampton. [For more information see the Map of Month article, "Indexing the Web with Geography Information", November 2000.] |
 |
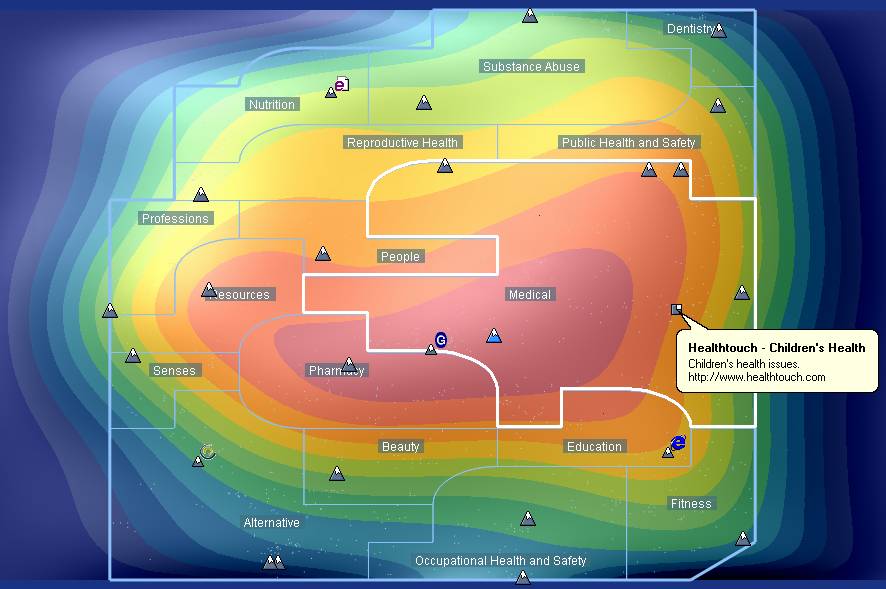
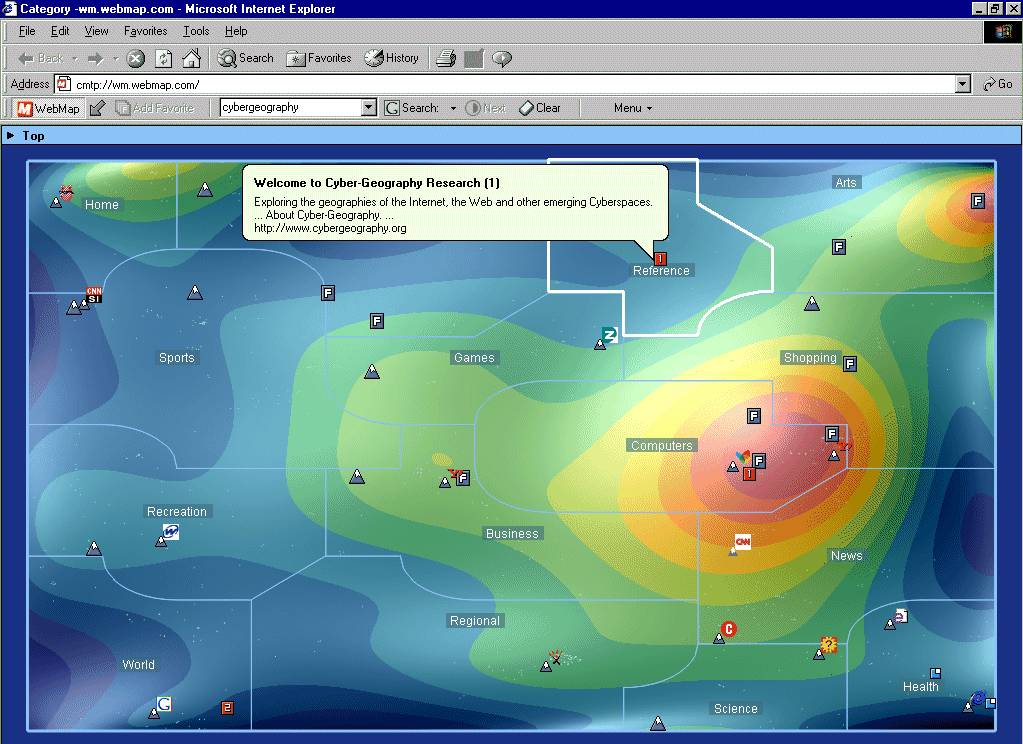
![]()
|
|
WebMap, an interactive, multi-level visual directory that maps 2 million plus web sites. It is a browser plug-in which represents hierarchical categories as irregular shaped polygons. A smooth zoom brings more detailed categories into view. Individual websites in the categories are shown by small mountain symbols. |
 |
|
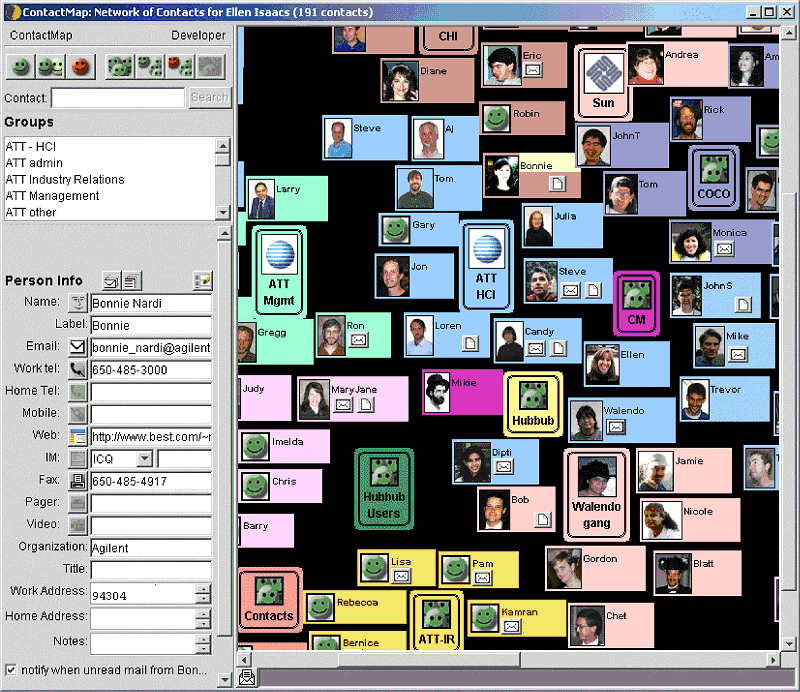
![]()
|
For more information see the paper "Integrating communication and information through ContactMap" by Bonnie A. Nardi, Steve Whittaker, Ellen Isaacs, Mike Creech, Jeff Johnson and John Hainsworth. |
 |
![]()
|
Sorry, the Cybergeography Research web pages are no longer being updated. The project ran from 1997-2004, but my research has moved away into other areas (see my blog for latest). If you have any questions or comments, please email me at: m.dodge (at) manchester.ac.uk. Cheers, Martin Dodge, February 2007. |