| Census | Topology | Info Maps | Info Landscapes | Info Spaces | ISP Maps | Weather Maps |
| Wireless |
|
Sorry, the Cybergeography Research web pages are no longer being updated. The project ran from 1997-2004, but my research has moved away into other areas (see my blog for latest). If you have any questions or comments, please email me at: m.dodge (at) manchester.ac.uk. Cheers, Martin Dodge, February 2007. |

Web site maps are created by webmasters and content providers to help users navigate and search complex web sites. A variety of styles of map are used, many based on organisational charts. Presented here are some of the best examples from around the Web.
|
An interactive Web site map called SiteBrain, which was a development of TheBrain information modelling technology to the Web. The example SiteBrain screenshot above is mapping the Web site for the graduate school of architecture and planning at Columbia University. |
![]()
|
|
 |
![]()
| Organisational chart type site maps. For example, Apple or Hilton Hotels Hilton.com web site from 1998 (Apple have since adopted a much more conventional site map and Hilton do not currently provide a site map.) |
 |
 |
| Dynamic Diagrams Inc. are a leading company in designing web site maps and navigation tools. One of the graphic styles they use is to maps sites in a perspective view, with individual web pages sticking up, a bit like a card index. A good example of these is shown below, a map of Britannica Online. |
| Dynamic
Diagrams have a Java product called MAPA, which produces interactive
web site maps. Two example MAPA web site maps are shown below, one for
part of IBM Corporation's web site and the other for part of Dynamic
Diagrams's own web site.
[For more information see the Map of the Month article "Web Site Maps from Dynamic Diagrams" in Mappa.Mundi Magazine.] |
 |
 |
| Tree Studio, developed by Inxight Software, provided a neat fisheye style interactive website map. It is a spin-off from information visualisation research at Xerox PARC. The example below is a Site Lens map of Monterey Bay Aquarium website. |
 |
 |
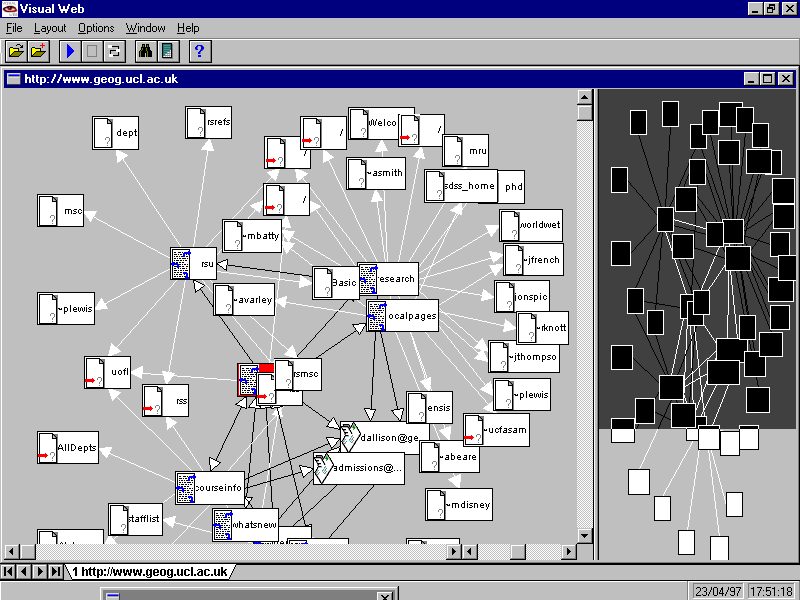
| Web site maps can also be created by site management tools. These software tools are designed to aid webmasters to visualise and manage large, complex web sites. We present screen-shots of from four of the best site management tools to give you an idea of the type of maps they produce. |
|
Below are screen-shots from Visual Web and Microsoft's Site Analyst (neither application is now available). |
 |
 |
 |
|

Site Manager from Silicon Graphics, a web site visualisation tool.
 |
 |
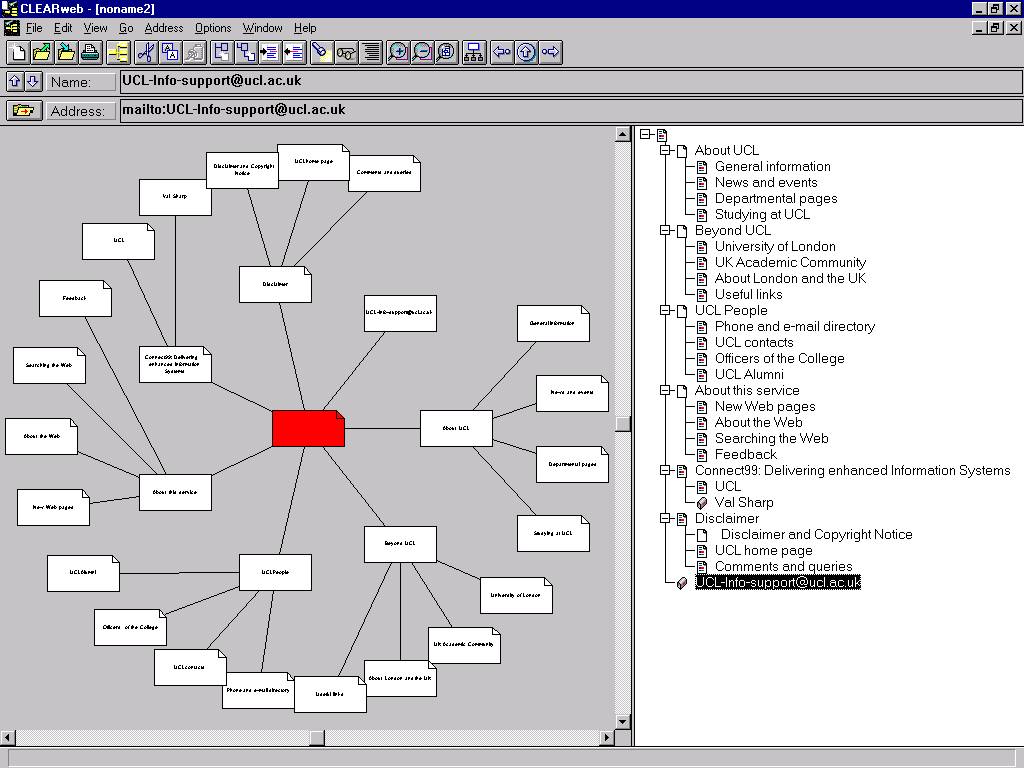
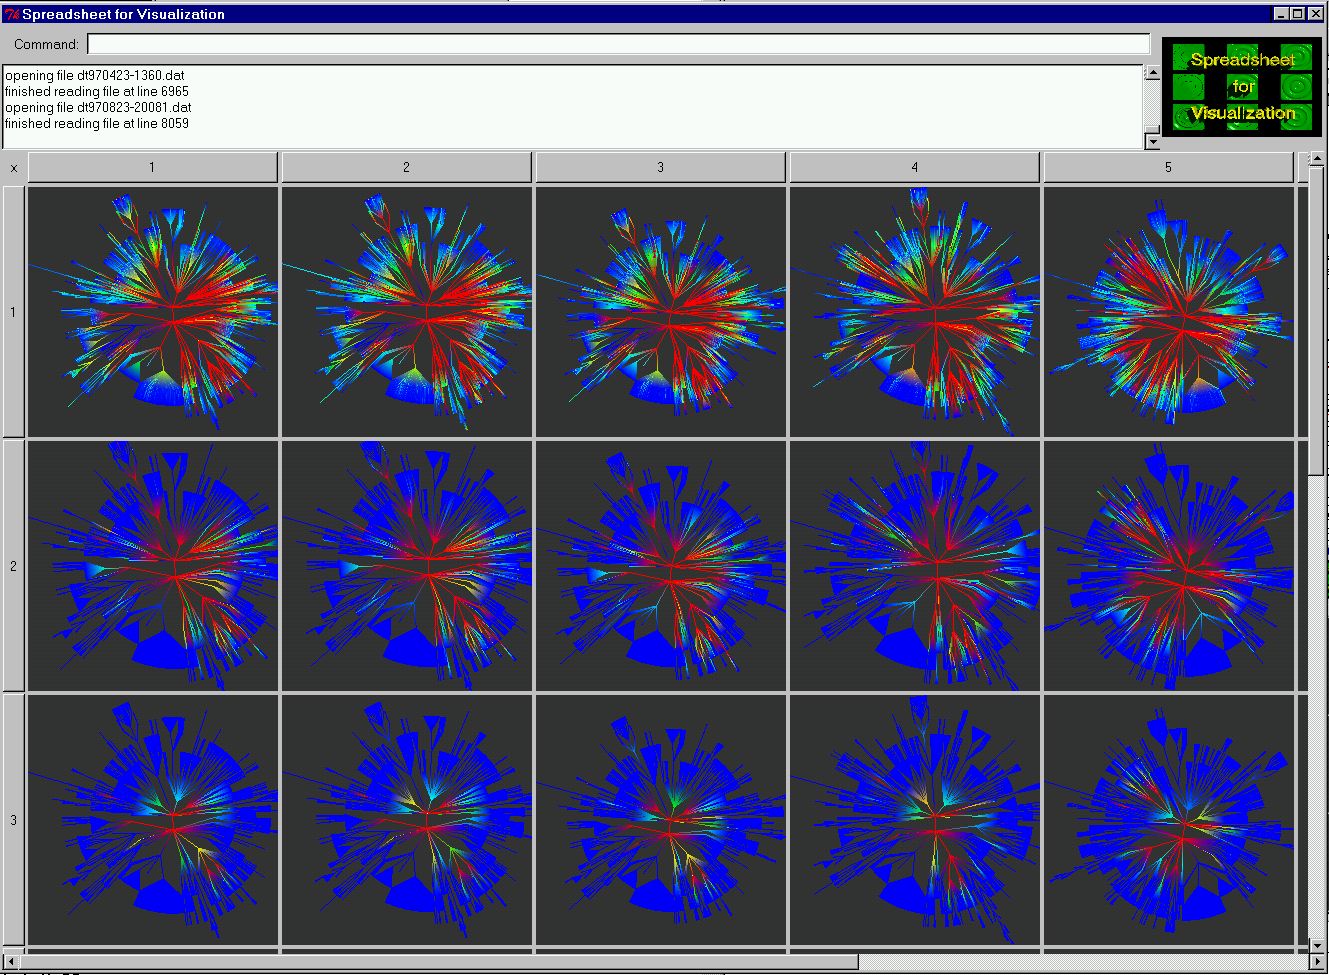
| Mapping the
evolving structure and content of large Web sites developed by Ed H.
Chi, Stuart K. Card and colleagues at the User
Interface Research group at Xerox PARC. The visualisation
examples above use Cone Trees and Disk Trees within an interactive
visualisation spreadsheet environment.
See their papers for further information on this innovative research, "Sensemaking of Evolving Web Site Using Visualization Spreadsheets" and "Visualizing the Evolution of Web Ecologies". |
| Nicheworks is a interactive tool for visualising massive networks with hundreds of thousands of nodes. It was developed by Graham Wills at Bell Labs. The screen-shots here show Nicheworks visualisation of the network structure of a large Web site. |
![]()
|
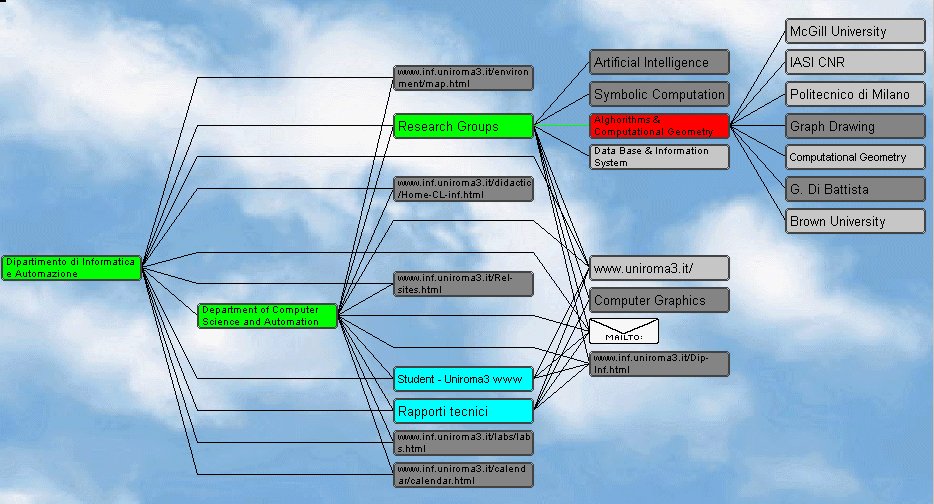
Ptolomaeus
- the Web cartographer, a nice tool for graphing the
hierarchical structure of Web sites being developed by Fabio
Vernacotola and colleagues in the Department of Informatica ed
Automazione at the University of Roma Tre, Italy.
|
|
To find out more on the types
and styles of web site maps you are recommended to consult Paul Kahn's
book Mapping
Websites (Rotovision, February 2001).
|
|
Sorry, the Cybergeography Research web pages are no longer being updated. The project ran from 1997-2004, but my research has moved away into other areas (see my blog for latest). If you have any questions or comments, please email me at: m.dodge (at) manchester.ac.uk. Cheers, Martin Dodge, February 2007. |