Click to skip over navigation
 

lecture 7: <area> tags

<< previous slide

return to lesson 7 index

next slide >>


This page is just a quick introduction to this topic. Ensure you read the relevant page in the online teaching materials after this lecture which discusses it in much more detail. There is also some reference material on this lecture's handout.

Hot spots are actually drawn with tags called <area> tags. These always go inside the relevant <map> and </map> tags. They do not take a closing tag, so remember to always include the / at the end of the tag. For each hot spot, you need one <area> tag.

In <area> tags, attributes are very important. This page briefly presents a list of which ones are used; have a look at the example below to see them in action. You may also like to refer back to this example once you've read the more detailed online teaching materials.

  • The shapes drawn by <area> tags can be circles, rectangles, or polygons (this last category pretty much takes care of everything that's not a circle or a rectangle). Decide on which shape is appropriate, and tell the browser this information using the attribute shape. All the hot spots in the example below are polygons, but use circles or rectangles if you can as these are rather easier to define.
  • To define the size and place of each hot spot you need to specify its co-ordinates. As you will quickly discover, this can be a fiddly job, although it's something you soon get the hang of. You will always need the help of another package to do this - as the next slide describes. These are then included in the coords attribute.
  • Finally, you need to specify where the hot spot is going to point. As with "ordinary" links, this is done with the href attribute. You can use an image map for any kind of link - external, internal, anchor, even a mailto link. Note that you can also include alt attributes in <area> tags, although these are only relevant for Internet Explorer so don't use them as your only means of putting across any important information.

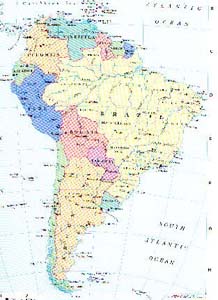
The finished result is as follows. Do play around with the image map itself, following some of the links and seeing which countries have been "activated" and where the hot spots actually are on screen. Compare what you can see with the code, referring back to the list of attributes above. This code also appears on your handout for this lecture.

A map of South America
Argentina Bolivia Brazil Colombia Ecuador

<img src="samerica.jpg" alt="A map of South America" height="300" width="218" usemap="#samerica" />
<map name="samerica">
  <area shape="poly" alt="Argentina" href="ext_countries.html#argentina" coords="109, 183, 99, 181, 104, 171, 72, 157, 58, 280, 98, 226, 104, 190" />
  <area shape="poly" alt="Bolivia" href="ext_countries.html#bolivia" coords="74, 106, 79, 117, 107, 143, 91, 148, 69, 156, 61, 137, 63, 111" />
  <area shape="poly" alt="Brazil" href="ext_countries.html#brazil" coords="74, 108, 79, 117, 107, 143, 120, 177, 106, 193, 122, 204, 203, 99, 131, 59, 65, 59, 43, 100" />
  <area shape="poly" alt="Colombia" href="ext_countries.html#colombia" coords="20, 60, 57, 75, 66, 40, 38, 22" />
  <area shape="poly" alt="Ecuador" href="ext_countries.html#ecuador" coords="19, 61, 35, 68, 12, 83" />


<< previous slide

return to lesson 7 index

next slide >>