Hyperspectral Images for Local Illumination in Natural Scenes 2015
1. Scenes
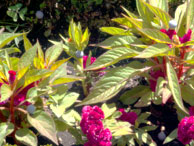
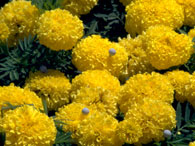
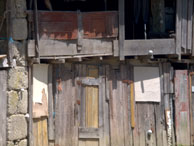
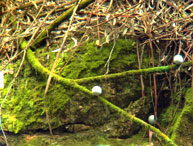
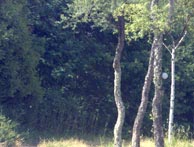
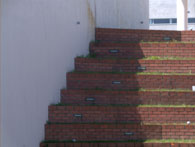
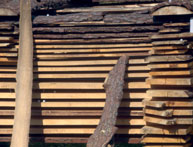
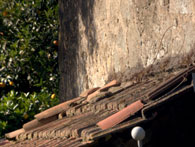
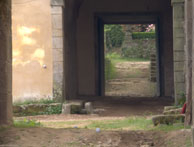
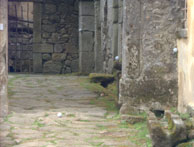
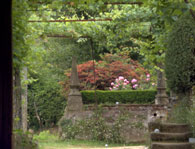
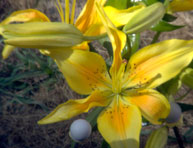
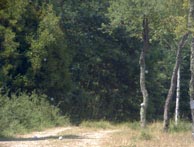
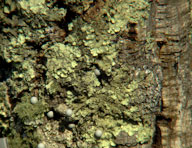
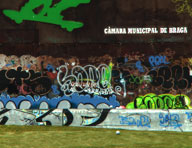
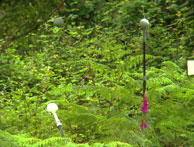
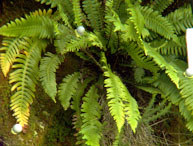
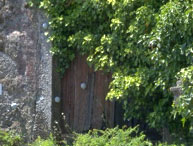
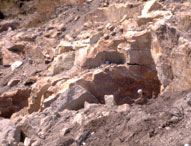
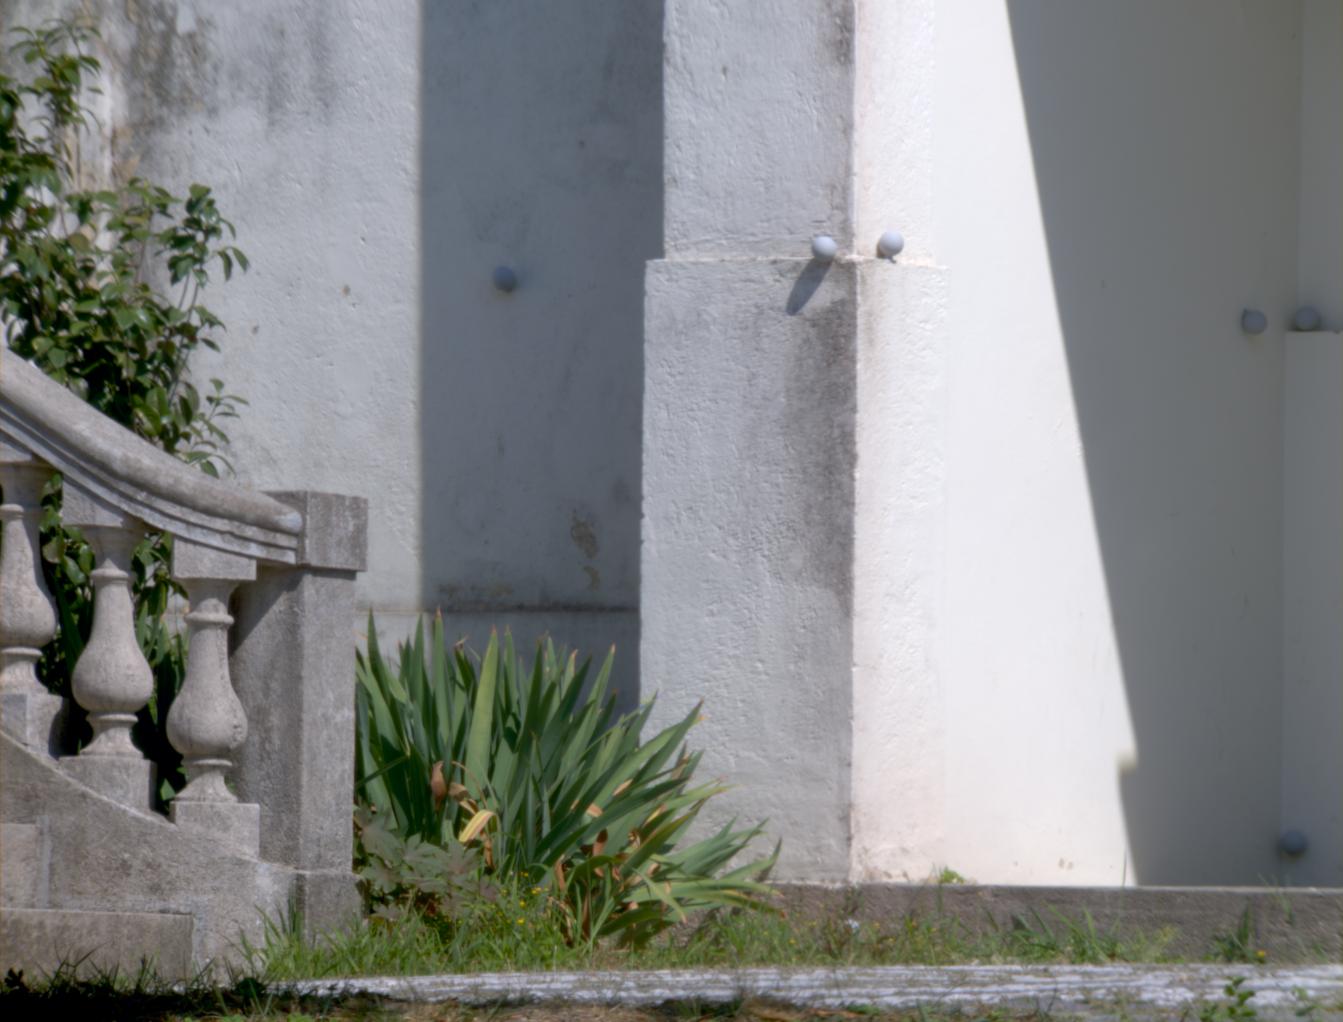
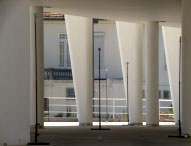
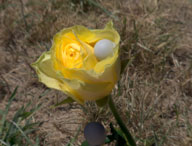
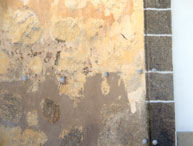
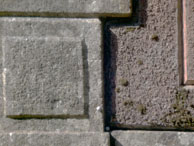
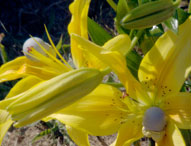
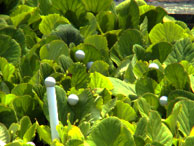
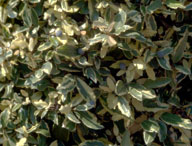
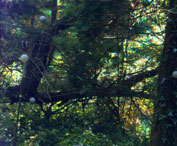
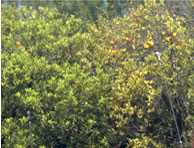
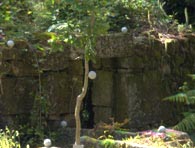
This set of hyperspectral radiance images has been taken from a study of scenes by Nascimento, Amano & Foster (2016). The set consists of 30 hyperspectral radiance images of natural scenes in which small neutral probe spheres were embedded to provide estimates of local illumination spectra. The 30 natural scenes are from the Minho region of Portugal and were acquired during late spring and summer of 2002 and 2003. The sky in most of the scenes was clear but in five it was overcast with cloud.
Each hyperspectral radiance image along with a full-size rendered RGB image and an information document can be downloaded as a zipped file by clicking on the "HSI" link beneath each thumbnail. The information document can be viewed separately as a PDF file by clicking on the adjacent "Information" link.
In three of the scenes, indicated with an asterisk against the HSI link, movement within the scenes introduced chromatic artifacts in the processed images. Details of image processing are given further down the page.
The images were acquired solely for analyzing spatial variations in local illumination and have not been made available previously. The images should be distinguished from similar images without multiple embedded spheres, e.g. here and here, used for other purposes.
These data are for personal use only. If you use the hyperspectral radiance images or the colour imagesrendered from them in any published work, please cite the source publication Nascimento, Amano & Foster (2016) Spatial distributions of local illumination color in natural scenes, Vision Research, 120, 39-44. doi:10.1016/j.visres.2015.07.005
 |
 |
 |
 |
 |
 |
| HSI | Information | HSI | Information | HSI | Information | HSI | Information | HSI | Information | HSI | Information |
 |
 |
 |
 |
 |
 |
| HSI | Information | HSI | Information | HSI | Information | HSI | Information | HSI | Information | HSI | Information |
 |
 |
 |
 |
 |
 |
| HSI | Information | HSI | Information | HSI | Information | HSI | Information | HSI | Information | HSI | Information |
 |
 |
 |
 |
 |
 |
| HSI | Information | HSI | Information | HSI | Information | HSI | Information | HSI | Information | HSI | Information |
 |
 |
 |
 |
 |
 |
| HSI | Information | HSI | Information | HSI | Information | HSI* | Information | HSI* | Information | HSI* | Information |
2. HSI files
Each
zipped HSI file contains a hyperspectral radiance image file in Matlab
MAT-file format. Each hyperspectral image has dimensions 1024
× 1344 × 33 and consists of a set of 33 greyscale images of
size 1344 (H) × 1024 (V) pixels sampled at wavelengths 400, 410, ...,
720 nm, with each pixel value representing spectral radiance in W m−2 sr−1
nm−1.
The hyperspectral imaging system, image acquisition, and image processing have been described in Nascimento, Amano & Foster (2016), Sect. 2, but for convenience details of the image processing are reproduced in the following section.
3. Image processing
The raw grayscale images were first corrected at each wavelength for
dark noise, stray light, and spatial non-uniformities. These corrected
images were then registered over wavelength by uniform scaling and
translation to compensate for small differences in optical image size
with wavelength, i.e. chromatic differences of magnification, and any
small differences in optical image position. Spectral radiances were
calibrated with reference to the spectrum of the light reflected from
an embedded surface covered in matt gray emulsion paint to produce the
surface reflectance of Munsell N5 or N7. This reference surface was
always present in each scene and its reflected spectrum was measured
with a telespectroradiometer at the time of image acquisition.
Depending on the scene the reference surface was either a small flat
surface or one of the neutral probe spheres embedded in the scene. The
hyperspectral radiance data at each pixel were corrected so that at the
reference surface the recorded spectrum coincided with that measured
with the telespectroradiometer.
4. Technical note on reflectance peaks and noise
For all scenes, the signal-to-noise ratio was low at the spectral extremes of the range 400-720 nm, but no wavelength data were discarded. In general, the signals at 400 and 720 nm make relatively small contributions to the in-vivo response of human cones to natural reflected spectra. Many natural scenes contain foliage, and foliage contains pigments such as chlorophylls, carotenoids, and anthocyanins, which give multiple large and small absorbance peaks distributed over the visible spectrum. Depending on the particular combination of these pigments, their presence can produce a variety of complex reflectance spectra from region to region (see Section 6 in Tutorial on Transforming Hyperspectral Images to RGB Colour Images).
5. Citing
These data are for personal use only. If you use the hyperspectral radiance images or the colour images rendered from them in any published work arising from these data, please cite the source publication: Nascimento, Amano & Foster (2016) Spatial distributions of local illumination color in natural scenes, Vision Research, 120, 39-44. doi:10.1016/j.visres.2015.07.005