 Multiple beam echo-sounding sonars are designed to measure the water depth within a series of
narrow 'pencil-like' beams, therefore creating a view of the
topography of the ocean floor. These systems are usually attached to ship's
hulls (e.g., manufacturers Sea Beam, Simrad, Hydrosweep, Reson).
Sidescan sonars are designed to produce acoustic images of the seabed by
sequentially scanning it with a narrow fan-shaped beam. These images
are analogous to terrestrial remote-sensing images, in
particular those from side-looking airborne radar
(sidescan sonars include GLORIA, SeaMARC II,
MR1). The figure on the right shows a GLORIA image collected by the US Geological Survey
and IOS (UK) of a lava flow and old seamounts near Hawaii, and illustrates
some of the difficulties of interpretation. The backscatter from
the seafloor varies because of the varying angle of incidence (hence
the shading around the seamounts) and also because of varying
bottom properties (hence the difference between the lava flow
and the adjacent sediments).
Many modern multibeam sonars are also capable of generating an
acoustic image, and sidescan sonars can have the capability of
measuring seafloor topography, so these systems are
becoming less distinct.
Multiple beam echo-sounding sonars are designed to measure the water depth within a series of
narrow 'pencil-like' beams, therefore creating a view of the
topography of the ocean floor. These systems are usually attached to ship's
hulls (e.g., manufacturers Sea Beam, Simrad, Hydrosweep, Reson).
Sidescan sonars are designed to produce acoustic images of the seabed by
sequentially scanning it with a narrow fan-shaped beam. These images
are analogous to terrestrial remote-sensing images, in
particular those from side-looking airborne radar
(sidescan sonars include GLORIA, SeaMARC II,
MR1). The figure on the right shows a GLORIA image collected by the US Geological Survey
and IOS (UK) of a lava flow and old seamounts near Hawaii, and illustrates
some of the difficulties of interpretation. The backscatter from
the seafloor varies because of the varying angle of incidence (hence
the shading around the seamounts) and also because of varying
bottom properties (hence the difference between the lava flow
and the adjacent sediments).
Many modern multibeam sonars are also capable of generating an
acoustic image, and sidescan sonars can have the capability of
measuring seafloor topography, so these systems are
becoming less distinct.
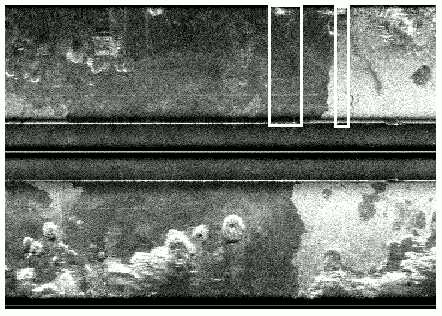
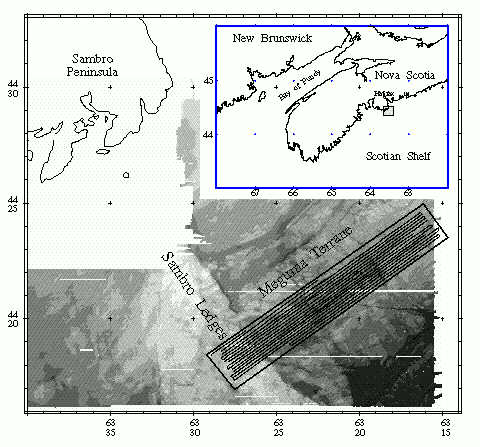
| Most attempts to classify the seabed have been based on data from either sidescan sonars (using measures of image texture) or from broad-scale bathymetry, but not from the combination of both sidescan sonar and bathymetry. This project, carried out in collaboration with the University of New Brunswick and the Canadian Hydrographic Service, attempted a simple seabed classification using backscatter, slope and curvature measures derived from Simrad EM1000 data. The test area was a section of the Nova Scotian shelf and the classification was used to isolate small pockets of silt in depressions. Using the classification to interrogate their surface properties, we found that the silts had small surface gradients directed away from the shoreline, which we speculated may reflect offshore transport of sediment during storms. This was a very simple demonstration but indicates that information obtained by combining bathymetry and backscatter should improve seabed classifications and allow further class-specific data to be extracted. The colour figures below show images of the bathymetry and backscatter collected during this programme. (Collaborator: John Hughes Clarke) Abstract |
|
|
Routes for submarine telephone cables are chosen with various competing issues in mind: the route must be safe for the cable, and hence should avoid bare rock or steep slopes, but also must be as short as possible to keep the costs of cabling low. This study, carried out mostly by an MSc student in Durham (John Spencer), developed a simple algorithm for locating routes through complex terrains. The multibeam data (left) were used to calculate a representation of potential hazards to the cable, such as due to steep slopes or bare rock. The algorithm then applied graph theory to trace a route across the hazard map, with distances between nodes artificially distorted according to the specified hazard values. Abstract |