Web Design |
the <area> tag |
||||||||||||||||
main menushelp pagesprinter-friendly/text-only version
|
This tag is the real meat of image maps. It won't work without the others - the <map> tags have to enclose <area> tags or they won't work, and you then need the usemap attribute to point to the map. But it's through the <area> tag that you "draw" out the hot spots; the equivalent of making those felt-pen marks on the overhead transparency. For each hot spot you want to trace, you need an <area> tag. (There is no closing tag, so remember to include the / at the end.) The first thing we need to tell the browser, then, is the shape of the hot spot. shape wasn't in bold for emphasis alone, but because it's the name of the relevant attribute in this case. It can take three values, though each of the three can appear in shorthand or the full version, as given in the table below. The next thing you need to tell the browser is the co-ordinates of the shape, in other words, where it actually is on the "transparency". Have a look at the table first, and then I'll explain how the co-ordinates can be established.
Elaborating on the table above, then, the coords attribute takes the following values depending on the shape:
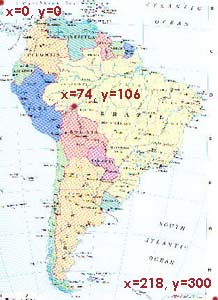
To actually work out where co-ordinates lie, you will need to load the image up into a graphics editor such as Paint Shop Pro or Photoshop. These have "information windows" which, when you place the cursor over a point in the image, will give you the x and y co-ordinates of that point. It doesn't take that long to write these down and work out where your hot spot shapes are located. However, there's an even quicker way, if you are using Paint Shop Pro. As detailed on the handout for the virtual lecture, you can use PSP's "Image Mapper" tool to draw out a map and it will create the code for you. It's important to remember, as noted in the lecture, that this is just "draft" code - you may still need to do a bit of work to validate it and you will, of course, need then to integrate it with the rest of your page. But, especially for complex maps like the map of the world used in the virtual lecture with its 64 separate hot spots, it's easier than a pencil and paper. It also helps you avoid overlaps. Finally, you will of course need to tell the browser where the hot spot links to. Normally this is done with an href attribute in the <area> tag, in the same way as for <a> tags. If you want to use a target attribute for whatever reason, stick that in there as well. By now you should know how to create the full version of the "South America" image map as was given in the virtual lecture. You can return there to look at the code, but it shouldn't be all that surprising. There are some other tags which can be used on image maps. alt can appear in <area> tags, giving different floating captions over different parts of the image. However, it doesn't really have application outside Internet Explorer so, as with any other image, don't depend on alt to display important information. You might even try using onClick events to produce alerts or other effects. | ||||||||||||||||
Material on this site is © Drew Whitworth, 2005 Permission will usually be given to reproduce material from this site for non-commercial purposes, if credit is given. For enquiries, e-mail Drew at andrew [dot] whitworth [at] manchester [dot] ac [dot] uk.