Web Design
Lesson 7: Printer-Friendly version
As with the other similar pages on this site, this page is designed to be easily printed out and read offline, away from the computer. If you are trying to follow this lesson online you will find it much more convenient to return to the full lesson 7 menu.
You can also go straight to the printer-friendly version of lesson 8 from here.
Contents
- 7.1 starting with image maps
- 7.2 the <map> tag
- 7.3 the <area> tag
- 7.4 multipart images
7.1 starting with image maps
The virtual lecture discussed the various applications of image maps and the ways in which you might use them. It also hopefully made clear the basic process: that you have an ordinary image, and then effectively lay a "transparency" over the top of this image which contains the "hot spots" that define the actual links. The place to start, then, is with an image file, and, therefore, an <img> tag. Please do pay close attention to the advice in the virtual lecture about what images make for good image maps, by the way.
The only difference with the <img> tag is that it contains a new attribute: usemap. This attribute basically says to the browser, "there's an image map (transparency) which I want to be laid over this image". This doesn't affect in any way the rendering of the image, so all other attributes (alt, height/width, src, possibly others such as style) can appear as before. (It is a good idea to use height and width when creating images as maps, as you do need to ensure the browser renders the image in the size you expect. Although it usually will anyway, best to be 100% sure.) usemap then takes a value of the name of the map being used.
(Sometimes you see the attribute ismap, but this attribute is involved in a slightly different technique known as server-side image maps. As it is unlikely you will have administrator access to a server, you will not be able to use these therefore I am not teaching them. usemap is for client-side image maps. The "client" is the reader of the page; what "client-side" means is that the image map is applied by the reader's computer (via the techniques I'm about to show you) rather than the host computer. But all in all, and having dragged you screaming to the end of this parenthetical note, I wouldn't worry about it.)
As you'll see in the brief section about the <map> tag (7.2), image maps take the name attribute in the same way as anchor tags (and other features of HTML we haven't yet investigated). And remember that when you want to point to a named anchor, you need to use the hashmark (#) character to refer to that name. The same applies to usemap. These are the only additions you need to make to the <IMG> tag in order to turn it into a map.
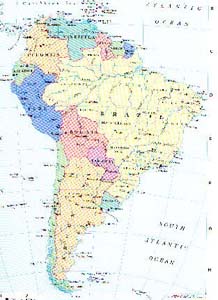
So, to refer back to the example used in the virtual lecture, this image has the following tag:
<img src="samerica.jpg" alt="A map of South
America" height="300" width="218"
usemap="#samerica" />
I haven't actually defined the code of the map, samerica, in this HTML file so there aren't any hot spots on this image. I'll build it up as we go through the next few pages.
Note also that the inclusion of usemap would usually give the image a "link border", even though it's not enclosed within <a> tags. If you don't want one, use styles to remove it (as I have done to all images on this site).
|
 |
Do note that while you're limited to one map per occurrence of an image, there's no reason why you couldn't duplicate an image on another web page - or even, further down the same web page - and have an entirely different map apply to it. All you do is change the value of usemap. Keep that analogy of the image and the transparency in your mind and remember that you can always lay a different transparency over the image, if one's prepared.
7.2 the <map> tag
It's almost not worth giving this tag a separate section, but I'll do so if only to separate it out from the more important <area> tag and therefore avoid confusion, well, hopefully anyway.
The <map> and </map> tags - and you do need the closing tag in this case - tell the browser where a particular image map (description of a "transparency") begin and end. In practice, they act as the container for all necessary <area> tags. <map> only takes one attribute, and it's an obligatory one - name. As in anchor tags (lesson 3), name can take whatever value you like, but avoid words that you know have another meaning in HTML or can be the values of attributes ("yes", for instance). In practice I usually end up calling it by the name of the image to which it refers, minus the extension - but remember what I said at the end of 7.1 above, that two completely different maps could in principle apply to the same image (though not the same occurrence of an image).
To continue building up our example map, then:
<img src="samerica.jpg" alt="A map of South America" height=300 width=218 usemap="#samerica" />
<map name="samerica">
[...<area> tags go here...]
</map>
Do note that although it's general practice to place the <map> immediately following the image to which it refers, there is absolutely no reason at all why this has to be the case. You could put it right at the end of the document (or, indeed, at the beginning) if you wanted to get it out of the way. It's probably more helpful to yourself to keep them in relatively close proximity, however.
Finally, as is always the case when you use name, make sure you get the hashmarks in the right places. When you define a name, you do not need the hashmark. When you refer to that name (in this case, via the usemap attribute), you do need it.
7.3 the <area> tag
This tag is the real meat of image maps. It won't work without the others - the <map> tags have to enclose <area> tags or they won't work, and you then need the usemap attribute to point to the map. But it's through the <area> tag that you "draw" out the hot spots; the equivalent of making those felt-pen marks on the overhead transparency. For each hot spot you want to trace, you need an <area> tag. (There is no closing tag, so remember to include the / at the end.)
The first thing we need to tell the browser, then, is the shape of the hot spot. shape wasn't in bold for emphasis alone, but because it's the name of the relevant attribute in this case. It can take three values, though each of the three can appear in shorthand or the full version, as given in the table below. The next thing you need to tell the browser is the co-ordinates of the shape, in other words, where it actually is on the "transparency". Have a look at the table first, and then I'll explain how the co-ordinates can be established.
Full shape value | Shorthand value | coords |
circle | circ | x, y, r |
rectangle | rect | x1, y1, x2, y2 |
polygon | poly | x1, y1, x2, y2, x3, y3.... xn, yn |
|
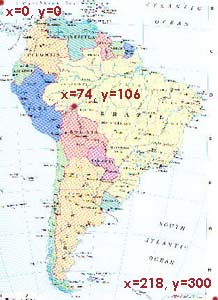
The co-ordinates of a point on an image are worked out in terms of pixels. Those who remember their GCSE maths should know that the x axis is the horizontal one, the y axis the vertical. However, unlike Cartesian co-ordinates, point (0, 0) is in the top left of an image. The map of South America, as should be clear from the height and width attributes, is 218 pixels wide (x axis) and 300 pixels high (y axis), so the bottom right pixel is (218, 300). The other point I've marked on the picture here - which happens to be, roughly, the northernmost tip of Bolivia - has its own unique pair of co-ordinates, and so indeed does every other one of the 65,400 pixels in this image. |
 |
Elaborating on the table above, then, the coords attribute takes the following values depending on the shape:
- circle: the x and y co-ordinate of the centre of the circle, then the radius of the circle in pixels. For instance: <area shape="circ" coords="55, 75, 20"> would create a hot spot 40 pixels in diameter centred on point 55, 75.
- rectangle: x1 and y1 are the co-ordinates of the top left of the rectangle; x2 and y2, bottom right.
- polygon: start with any vertex of the polygon and call this x1, y1. Then trace round each vertex in turn. The fewest you'll have, therefore, is three pairs of x, y co-ordinates (which would create a triangle). The "Bolivia" example below would have seven pairs. Note that you don't need to repeat the first vertex at the end; the browser will fill in the final "line" for you. Also please realise that you don't have to be absolutely precise, tracing round every last crinkle in some map or other. Similiarly, the faces traced out on the example at the end of this page are just circles; you don't have to go round ears, hair etc.! Something vaguely right is enough - and also, make sure hot spots don't overlap.
To actually work out where co-ordinates lie, you will need to load the image up into a graphics editor such as Paint Shop Pro or Photoshop. These have "information windows" which, when you place the cursor over a point in the image, will give you the x and y co-ordinates of that point. It doesn't take that long to write these down and work out where your hot spot shapes are located. However, there's an even quicker way, if you are using Paint Shop Pro. As detailed on the handout for the virtual lecture, you can use PSP's "Image Mapper" tool to draw out a map and it will create the code for you. It's important to remember, as noted in the lecture, that this is just "draft" code - you may still need to do a bit of work to validate it and you will, of course, need then to integrate it with the rest of your page. But, especially for complex maps like the map of the world used in the virtual lecture with its 64 separate hot spots, it's easier than a pencil and paper. It also helps you avoid overlaps.
Finally, you will of course need to tell the browser where the hot spot links to. Normally this is done with an href attribute in the <area> tag, in the same way as for <a> tags. If you want to use a target attribute for whatever reason (see lecture 10), stick that in there as well. By now you should know how to create the full version of the "South America" image map as was given in the virtual lecture. You can return there to look at the code, but it shouldn't be all that surprising.
There are some other tags which can be used on image maps. alt can appear in <area> tags, giving different floating captions over different parts of the image. However, it doesn't really have application outside Internet Explorer so, as with any other image, don't depend on alt to display important information. You might even try using onclick events to produce alerts or other effects - see lecture 8.
7.4 multipart images
Multipart images are a sort of alternative to image maps, though in practical terms the technique is quite different. Nevertheless, the end effect is similar: that different parts of an image can be made to behave in different ways. In fact, professional web designers are more likely to use this version of the technique than the "ordinary" image map. As the virtual lecture discussed, there are distinct advantages to this technique over image maps:
- you can give different parts of the image a different alt attribute (although this is, technically, possible on image maps as well with IE but it does not work with other browsers) - this makes it less necessary to provide a text-based alternative menu
- the image will load in sections, in a kind of "jigsaw" fashion - this can give the user something to look at on screen while he/she waits to view the full page, rather than having to watch an entirely blank screen while awaiting the loading of a larger image - this can help you retain their attention and stop them quickly going somewhere else
- it makes it possible to fit images "around" text and other non-image page elements like form boxes
- different parts of the image can be rendered in different formats
- significantly, you can make sections of the image update independently from the rest of the image via image rollovers (see 8.1).
A small disadvantage to the technique is that you cannot work with anything other than rectangular sections, because to "slice up" the image, you need to use a table. Unlike <area> tags, <td>s cannot define circular or polygonal shapes. However, with some ingenuity, this isn't really a big problem. I also used to point out that the main disadvantage with this technique is that it was a damn sight more difficult than image maps, but if you become familiar with Paint Shop Pro's "Image Slicer" tool, this is not the case (although as the lecture pointed out you will need to do quite a bit of work tidying up its rather clunky code). In fact so useful is this tool that I no longer feel it necessary to go into detail about how to create multipart images "by hand".
What I do recommend is that you have a good look at the handout from lecture 7 as this contains information about how to use the Image Slicer and what the code ultimately looks like. It may be, of course, that you want to create an image like this and do not have access to Paint Shop Pro, although other graphics editing packages should also be able to help you out. You can create these images "manually" but you will never be able to do so without some form of graphics editor, so you may as well make use of what help is available.
The sample multipart image used in the lecture was only a starting point. In subsequent lectures we will also look at an enhanced version of that image with added rollovers (lecture 8), and further developments in lectures 9 and 10. Recall also the University of Leeds home page (http://www.leeds.ac.uk) which was all arranged using a multipart image. One word of warning, though - that it fixes the size of portions of your page in pixels, precisely. (What a lot of Ps that was.) Change the screen or window size and you risk losing a lot of it. You will note that the content of the Leeds Uni page does not extend right across the screen, but stops part way. In fact, it stops after 800 pixels. If a page still looks OK when a window or monitor screen is as small as 800 pixels wide, this is generally considered acceptable design, and any fixed-width tables you use for page layout definitely should not be any wider han 800 pixels.
End of lecture 7.