Hyperspectral Images of Natural Scenes 2004
1. Scenes
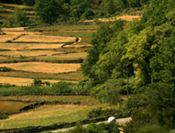
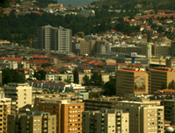
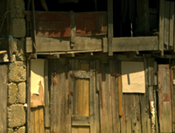
The eight hyperspectral images available here were acquired from the same sites as those illustrated in Figure 1 of Foster, Nascimento, and Amano, 2004, and are a representative sample of the 25 images used in that study. They consisted of a mixture of rural scenes from the Minho region of Portugal, containing, rocks, trees, leaves, grass, and earth and urban scenes from the cities of Porto and Braga, Portugal. Images were obtained during the summers of 2002 and 2003, almost always under a clear sky. Particular care was taken to avoid scenes containing movement. Scenes were illuminated by direct sunlight in clear or almost clear sky. Colour pictures of the eight representative scenes are shown here, and full-size versions (each about 4MB) can be downloaded by clicking on each.The estimated reflectance spectra (effective spectral reflectances)
at each pixel in each of these example scenes can be downloaded as a
WinZip file by clicking on the link at the bottom of each
picture. Each zipped file contains for each scene a Matlab
scene-reflectances file (size e.g. 1018 x 1339 x 33), a Matlab
radiance-by-reflectances file for converting reflectances to radiances
(33 x 2), a Matlab reflectances file for the Munsell surface in the
scene (33 x 2), a bright BMP image of the scene, and a Microsoft RTF
information file. The version of Matlab used to save these files
was 7.2.0.232 (R2006a). Details of the hyperspectral system, image
acquisition, and processing are given further down the page.
If you use these images, please cite this source publication: Foster, D.H., Amano, K., Nascimento, S.M.C., & Foster, M.J. (2006). Frequency of metamerism in natural scenes. Journal of the Optical Society of America A, 23, 2359-2372.
Additional hyperspectral radiance images taken at intervals across the day are here and with probe spheres for estimating local illumination spectra are here.
 |
 |
 |
 |
|
Scene 1 Download
386MB zip
file |
Scene 2 Download
398MB zip
file |
Scene 3 Download
361MB zip
file |
Scene 4 Download
188MB zip
file |
 |
 |
 |
 |
|
Scene 5 Download
380MB zip
file |
Scene 6 Download
183MB zip
file |
Scene 7 Download
180MB zip
file |
Scene 8 Download
177MB zip
file |
2. Details of hyperspectral system, image acquisition, and processing
The present system used a low-noise Peltier-cooled digital camera providing an x-y spatial resolution of 1344 x 1024 pixels (Hamamatsu, model C4742-95-12ER, Hamamatsu Photonics K. K., Japan) with a fast tunable liquid-crystal filter (VariSpec, model VS-VIS2-10-HC-35-SQ, Cambridge Research & Instrumentation, Inc., MA) mounted in front of the lens, together with an infrared blocking filter. Focal length was typically set to 75 mm and aperture to f/16 or f/22 to achieve a large depth of focus. The line-spread function of the system was close to Gaussian with standard deviation approx. 1.3 pixels at 550 nm. The intensity response at each pixel, recorded with 12-bit precision, was linear over the entire dynamic range. The peak-transmission wavelength was varied over 400–720 nm with bandwidth (full width at half maximum) of 10 nm at 550 nm, decreasing to 7 nm at 400 nm and increasing to 16 nm at 720 nm. The acceptance angle of the camera was approx. 6 deg of visual angle.
Before image acquisition, the exposure at each wavelength was determined by an automatic routine so that maximum pixel output was within 86–90% of saturation. Immediately after acquisition, the reflected spectrum from a small flat grey (Munsell N5 or N7) reference surface in the scene was recorded with a telespectroradiometer (SpectraColorimeter, PR-650, Photo Research Inc., Chatsworth, CA), the calibration of which was traceable to the National Physical Laboratory.
The raw images acquired by the hyperspectral camera were corrected for dark noise, spatial nonuniformities (mainly off-axis vignetting), stray light, and any wavelength-dependent variations in magnification or translation.
The wavelength range of 400-720 nm was sampled at 10-nm intervals. For all scenes, the signal-to-noise ratio was low at the spectral extremes, but no wavelength data were discarded except for Scene 5. In general, the signals at 400 and 720 nm make relatively small contributions to the in-vivo response of human cones to natural reflected spectra.
* For Scene 5, the signal-to-noise ratio at 720 nm was exceptionally low and the wavelength range was restricted to 400-710 nm, so the size of this scene-reflectances file is 1020 × 1339 × 32.
Edited versions (labelled "_lax") have also been included for Scenes
1, 2, 3, and 5. These edited versions have been corrected for
some nonlinear chromatic artefacts arising from movement of foliage
within the scene during image acquisition.
Effective spectral reflectances at each pixel were estimated by
normalizing the corrected signal against that obtained from the grey
reference surface in the scene. An informal description of
effective spectral reflectances and the effective global illuminant are
given below in Section 3. Further technical details are given in Foster et al. (2006),
the latter including additional calibration data (p. 2360) and an
analysis of effective spectral reflectances with direct and indirect
illumination (Appendix
A, pp. 2370-2371).
These data are for personal use only. Acknowledgement of the relevant source publications should be given in any published work arising from these data: Foster, D.H., Amano, K., Nascimento, S.M.C., & Foster, M.J. (2006). Frequency of metamerism in natural scenes. Journal of the Optical Society of America A, 23, 2359-2372.
3. Technical notes on effective spectral reflectances and effective global illuminant
The effective spectral reflectance at each pixel was obtained by dividing the spectral radiance recorded by the hyperspectral camera at that position and wavelength by the spectral radiance recorded from a calibrated neutral reference surface (a Munsell grey) in the scene and then multiplying by the known spectral reflectance of the reference surface. The reference surface was usually flat and placed vertically facing the camera. Because surfaces oriented at an angle to the camera may reflect more light than vertical surfaces, their effective spectral reflectances may exceed unity.
There are three ways to deal with this anomaly.
1. If there is a Munsell grey sphere in the scene with a visible
highlight, then multiply (wavelength-by-wavelength) the effective
spectral reflectance at each pixel by the effective spectral
reflectance at the flat reference and then divide by the effective
spectral reflectance at the highlight. If there is a true specular
highlight in the scene, e.g. from water (Scene 4, top right-hand
corner), then this might instead be used as the divisor or it can be
removed altogether from the calculation.
2. Divide all the effective spectral reflectances in the scene by a
constant equal to the maximum effective spectral reflectance evaluated
over all pixels and wavelengths.
3. Ignore it. The effective spectral reflectances are normally used
to calculate a reflected spectrum. Multiplying the effective spectral
reflectance by the data in the radiance-by-reflectances file recovers
the original spectral radiance recorded by the camera. Multiplying
instead by a new different illuminant spectrum will simulate the effect
of replacing the original illuminant by this new illuminant. Thus there
is a trade-off between decreasing all the spectral reflectances in the
scene by a constant factor, as in method 2, and increasing the
illuminant spectrum by the same factor.
The spectrum of the effective global illuminant was obtained by taking the actual reflected spectrum from a calibrated neutral reference surface (a Munsell grey) in the scene recorded with a telespectroradiometer and dividing by the known spectral reflectance of that surface. The spectral radiance recorded by the hyperspectral camera at each position may then interpreted as a product of this effective global illuminant and the effective spectral reflectance at that position.
Further technical details are given in Foster et al. (2006), particularly Appendix A, pp. 2370-2371.
A comparison of simulated global illuminant changes and real illumination changes is available in Foster, D.H., Amano, K., & Nascimento, S.M.C. (2016). Time-lapse ratios of cone excitations in natural scenes. Vision Research, 120, 45-60, Section 3.6.
4. Tutorial on transforming hyperspectral images
Click here
for a tutorial on transforming hyperspectral image reflectances
into reflected radiances and RGB colour images.
The tutorial includes sample code (MATLAB, The MathWorks Inc) and technical notes on the interpretation of reflectance spectra from natural scenes. Also available for download is a zipped package containing a small test hyperspectral image, daylight illuminant spectra, and a conversion routine for producing sRGB images.