Hyperspectral Images of Natural Scenes 2002
1. Scenes
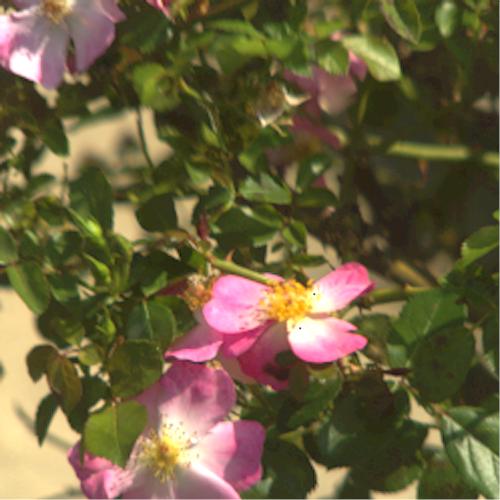
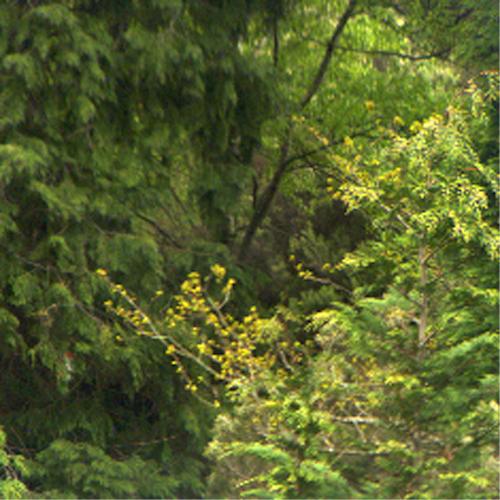
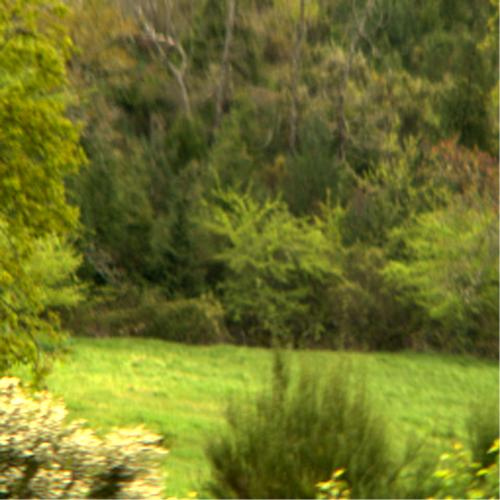
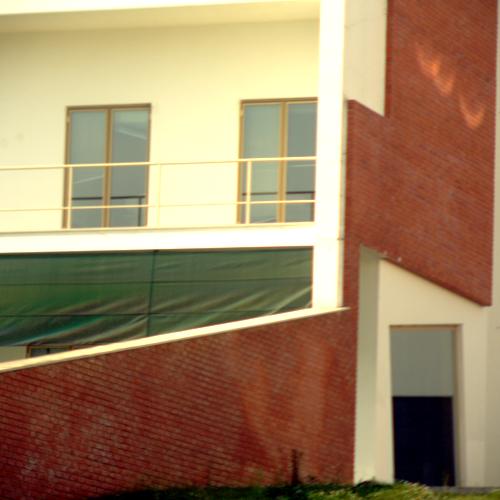
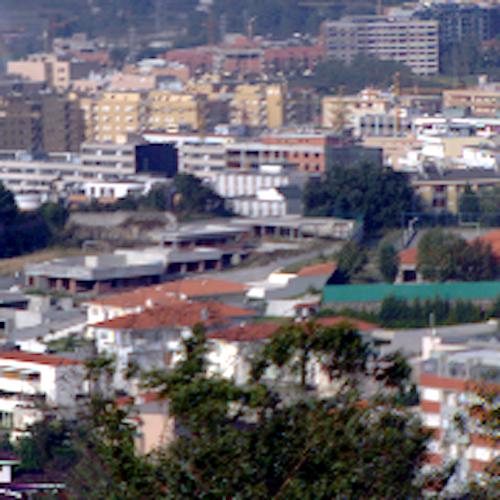
Images of 30 scenes were used in the study described by Nascimento, Ferreira, and Foster, 2002. They comprised 15 rural scenes in the Minho region of Portugal, each containing, rocks, trees, leaves, grass, and earth and 15 urban scenes, from the cities of Porto and Braga, Portugal. All images were acquired during the summers of 1999 and 2000 under daylight at between mid-morning and mid-afternoon. Scenes were illuminated by direct sunlight in clear or almost clear sky; if clouds were present, care was taken to avoid variations in illumination during image acquisition. Images of eight representative scenes are shown here.The estimated reflectance spectra derived for each scene can be downloaded as zipped Matlab files by clicking on the link at the bottom of each picture. The zipped file size and the sizes of the spatial and wavelength dimensions of each scene are indicated. Details of the hyperspectral system, image acquisition, and processing are given further down the page.
Legacy versions of the images without individual cropping are available here.
If you use these images, please cite this source publication: Nascimento, S.M.C., Ferreira, F.P., & Foster, D.H. (2002). Statistics of spatial cone-excitation ratios in natural scenes. Journal of the Optical Society of America A, 19, 1484-1490.
Hyperspectral radiance images of natural scenes taken at a higher resolution are available here. Images taken at intervals across the day are available here and with probe spheres for estimating local illumination spectra here.
 |
|
 |
 |
|
Scene 1 (123MB: 748×820×31) |
Scene 2 (61MB: 700×820×31) | Scene 3 (89MB: 750×820×31) | Scene 4 (106MB: 664×725×31) |
 |
 |
 |
 |
| Scene 5 (141MB: 819×812×31) | Scene 6 (76MB: 755×468×31) | Scene 7 (60MB: 682×418×31) | Scene 8 (93MB: 700×608×31) |
2. Details of hyperspectral system, image acquisition, and processing
Hyperspectral images were acquired with a progressive-scanning monochrome digital camera (Pulnix TM-1010, Pulnix America Inc., Sunnyvale, CA, USA) with a CCD array of 1024 by 1024 pixels and 10-bit output (for fast transfer of the data to the computer, only the central portion of each image, not exceeding 820 by 820 pixels, was usually captured). The camera had an electronic shutter with a timer controlled by an external signal. The acceptance angle of the camera was approx. 6 deg of visual angle.
A tunable birefringent filter (VariSpec, model VS-VIS2-10HC-35-SQ, Cambridge Research & Instrumentation, Inc., Boston, MA, USA) was mounted in front of the lens. The peak-transmission wavelength was varied over 400–720 nm with bandwidth (full width at half maximum) of 10 nm at 550 nm, decreasing to 6 nm at 400 nm and increasing to 16 nm at 720 nm. Out-of-band transmission was less than 0.01%. The filter had a 35-mm aperture and a field of view of 7 deg.
The images were captured with a frame grabber with a digital input board (Matrox Corona/8/E, Matrox Electronic Systems Ltd., Quebec, Canada). The frame grabber also provided the external signal needed to control the electronic shutter of the camera.
For each scene, two hyperspectral sequences of signal images were obtained, namely, a sequence of raw scene images and a sequence of "light-reference" (flat-field) images, along with two corresponding sequences of noise images. Scene images were obtained by pointing the camera at the scene under study, adjusting the focus and zoom, and recording the sequence. Flat-field images were obtained with the same optical arrangement but with the camera pointing at a flat, uniformly reflecting, uniformly lit surface that was interposed between the scene and the camera.Noise images were obtained in the same way but with the camera entrance aperture blocked.
For each scene, exposure time at each wavelength was determined by an automatic routine which was executed before image acquisition, so that the maximum output at any pixel was within 86–90% of the CCD saturation value. Each complete sequence of 33 spectral images took between 5 and 15 s to acquire, depending on the light levels on the scene. Particular care was taken to avoid recording scenes containing movement.
To correct for the effects of noise, the noise images were subtracted at each wavelength from their corresponding scene and flat-field images. To correct for the effects of transmission through the optical system (mainly off-axis vignetting by the tunable filter), the noise-corrected scene image was divided at each wavelength by the noise-corrected flat-field image.
Effective spectral-reflectance functions for each pixel element were then estimated by normalizing this corrected signal at each pixel against that obtained with a white standard derived from a small gray surface with a flat reflectance spectrum placed near the edge of the scene. This reference surface and any regions near the edges with low signal-to-noise were subsequently cropped from the scene. The illumination was assumed to be spatially uniform in each scene. For applications where shadows cannot be ignored, they should be cropped from the scene (see Nascimento, Ferreira, and Foster, 2002).
The wavelength range of 400-720 nm was sampled at 10-nm intervals. Each of the four image sequences for each scene therefore consisted of 33 images, but because of low signal-to-noise ratios at the spectral extremes, data for 400 nm and 720 nm were eventually discarded, so that the wavelength range was reduced to 410-710 nm. In general, signals at 400 and 720 nm make relatively small contributions to the in-vivo response of human cones to natural reflected spectra. Because surfaces oriented at an angle to the camera may reflect more light than a vertical surface, their effective spectral reflectances may exceed unity. Ways of dealing with this anomaly are discussed in Section 3 of the page Hyperspectral images of natural scenes 2004. A detailed analysis is available in Appendix A of Foster, D.H., Amano, K., Nascimento, S.M.C., & Foster, M.J. (2006). Frequency of metamerism in natural scenes. Journal of the Optical Society of America A, 23, 2359-2372.These data are for personal use only. Acknowledgement of the relevant source publication should be given in any published work arising from these data: Nascimento, S.M.C., Ferreira, F.P., & Foster, D.H. (2002). Statistics of spatial cone-excitation ratios in natural scenes. Journal of the Optical Society of America A, 19, 1484-1490.
3. Tutorial on transforming hyperspectral images
Click
here
for a tutorial on
transforming hyperspectral image reflectances into reflected radiances
and RGB colour images.
The tutorial includes sample code (MATLAB, The MathWorks Inc) and technical notes on the interpretation of reflectance spectra from natural scenes. Also available for download is a zipped package containing a small test hyperspectral image, daylight illuminant spectra, and a conversion routine for producing sRGB images.