Bootstrap Thresholds
1. Basics
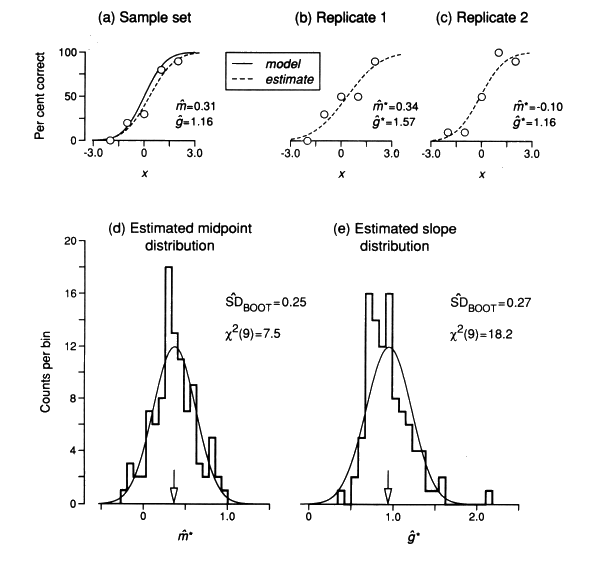
The bootstrap provides a powerful, general procedure for estimating the accuracy of a statistical estimate derived from a set of experimental data. The illustration below shows how bootstrap standard deviations are calculated from a sample stimulus-response curve or psychometric function.

Panels (b) and (c) show individual bootstrap replicates generated from the estimated psychometric function fitted to the sample set in (a). Notice the different values of midpoint and slope in the two replicates.
Panels (d) and (e) show histograms of the values of midpoint and slope obtained from 100 bootstrap replicates like those in (b) and (c). For comparison, the smooth curves are normal distributions with the same means and standard deviations as the bootstrap histograms. Their goodness of fit is shown by the chi-squared values.
For further details see Foster, D. H. & Bischof, W. F. (1991) Thresholds from psychometric functions: Superiority of bootstrap to incremental and probit variance estimators, Psychological Bulletin, 109, 152-159.
2. Portable software for threshold estimates
David
Foster and Walter
Bischof have developed a portable version of this bootstrap
threshold program called bootprob.
This program fits a Gaussian cumulative distribution function to a set
of binomial data and saves the fitted curve in a separate file called
fitted_curve.txt. It gives the threshold
(for a given criterion level of performance), the gradient (slope), and
1/gradient (spread) for the fitted curve. It
then estimates the standard deviations (SDs) and confidence intervals
(CIs) of the threshold, slope, and spread by a bootstrap procedure (the
'parametric' bootstrap).
The bootstrap procedure is similar to that described in Foster and Bischof (1991), but a more robust procedure has been adopted here in that SDs are computed from centiles, assuming an approximately normal distribution. When that assumption is violated, CIs should be used anyway. For an introduction to the software, see Foster, D.H. & Bischof, W.F. (1997) Bootstrap estimates of the statistical accuracy of thresholds obtained from psychometric functions. Spatial Vision, 11, 135-139.
The program bootprob is available in several versions:
- boot.txt, a
plain text file (with source code, readme, notice, and test files)
- bootpc.zip, a PC version in zip format (containing a Windows executable program, and source code, readme, notice, and test files)
- bootunix.tar, a Unix version (in tar format, containing source code, readme, notice, and test files)
If you use these routines, would you please cite this source publication: Foster, D.H. & Bischof, W.F. (1997) Bootstrap estimates of the statistical accuracy of thresholds obtained from psychometric functions. Spatial Vision, 11, 135-139.
3. Portable software for threshold difference estimates
Another portable bootstrap program is available called bootprobdiff for comparing thresholds and other properties of two psychometric functions.
This program fits Gaussian cumulative distribution functions to two sets of binomial data and saves the fitted curves in separate files. It gives the threshold (for a given criterion level of performance), the slope, and spread for each of the fitted curves, and the differences in threshold, slope, and spread. It then estimates the standard deviations (SDs) and confidence intervals (CIs) of these differences by the bootstrap procedure. The confidence intervals can be used to decide whether the two thresholds (or two slopes or two spreads) are significantly different from each other, as explained in the readme file.
The program bootprobdiff is available in several versions:
- bootdiff.txt, a plain text file (with source code, readme, notice, and test files)
- bootdiffpc.zip, a PC version in zip format (containing a Windows executable program, and source code, readme, notice, and test files)
- bootdiffunix.tar, a Unix version (in tar format, containing source code, readme, notice, and test files)
If you use these routines, would you please cite this source publication: Foster, D.H. & Bischof, W.F. (1997) Bootstrap estimates of the statistical accuracy of thresholds obtained from psychometric functions. Spatial Vision, 11, 135-139.
Mirrored at https://webdocs.cs.ualberta.ca/~wfb/bootstrap.html
4. Model-free psychometric functions
Software for fitting a stimulus-response curve and estimating a threshold and standard deviation without assuming a Gaussian cumulative distribution function, is available here. One package is for MATLAB (The Mathworks, Inc., Natick, MA, http://www.mathworks.co.uk/index.html) and the other is for R (http://www.r-project.org/),