Color Constancy
This material was developed for a review published in Vision Research, 2011. If
you use this material, please cite the source publication in full: Foster, D.H. (2011).
Color constancy. Vision Research, 51, 674-700, doi:10.1016/j.visres.2010.09.006.
1. Definition of Color Constancy
Color constancy is usually defined as the effect whereby the perceived or apparent color of a surface remains constant despite changes in the intensity and spectral composition of the illumination. Less commonly, it is defined not as remaining constant but as tending to remain constant. Strictly, the modifier "tends" is unnecessary, since color constancy itself is often described in graded terms, particularly with the aid of an index, values of which are given below.Figure 1 shows the effect on a scene of an extreme change in illumination, from (a) reddish direct sunlight to (b) bluish light from the north sky, along with the corresponding reflected spectra from the surface of a petal. Isolated lights with these two spectra appear very different, but when viewed in the context of the scene (not side-by-side as illustrated here) the surface reflecting these lights is judged by experimental observers to be the same.
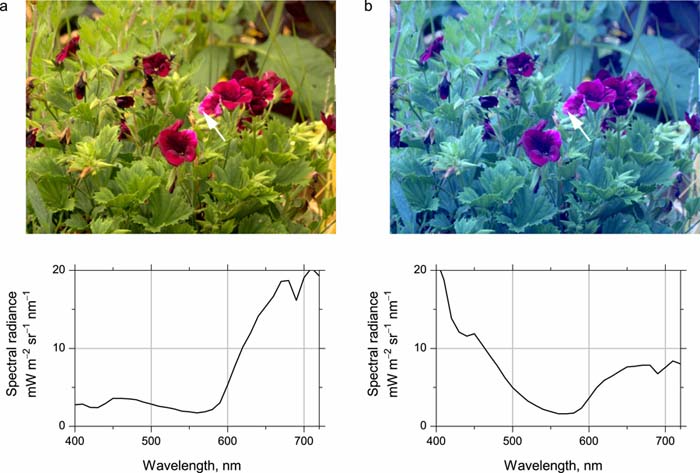 |
| Fig. 1. Images of a pelargonium under sunlight and skylight with respective correlated color temperatures (a) 4000 K and (b) 25,000 K and the corresponding radiance spectra reflected from the arrowed region of a petal (simulated from author’s unpublished hyperspectral data). From Foster (2011). |
2. Indices of Color Constancy
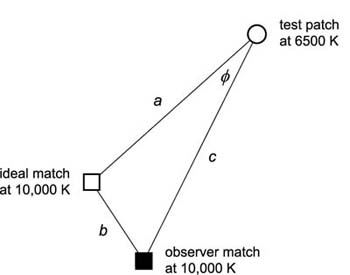
The degree to which color constancy succeeds—or fails—can be measured by the difference (or "error") between the results of an observer’s experimental judgment (e.g. a color match or color setting) and an ideal value in some appropriate color space. The degree of color constancy is usually measured by an index, ranging typically from 0 to 1, which expresses the ratio of the error to the change in illumination spectrum. Figure 2 shows how two of the most common indices are calculated in a two-dimensional chromaticity space.
|
Fig. 2. Definition of color-constancy index and Brunswik ratios. The three points show the coordinates of a test surface under daylight with correlated color temperature (CCT) 6500 K (open circle), the ideal match under daylight with CCT 10,000 K (open square), and the corresponding observer match (solid square). The constancy index is defined by CI = 1 − b/a; the Brunswik ratio by BR = c/a; and its projection by BRø = c cos ø/a. From Foster (2011). |
3. Table of Color Constancy Indices and Experimental Methods
Table 1 here or here lists 80 color constancy indices and Brunswik ratios derived from published reports classified according to experimental method. For further details, see Foster, D.H. (2011). Color constancy. Vision Research, 51, 674-700, doi:10.1016/j.visres.2010.09.006.