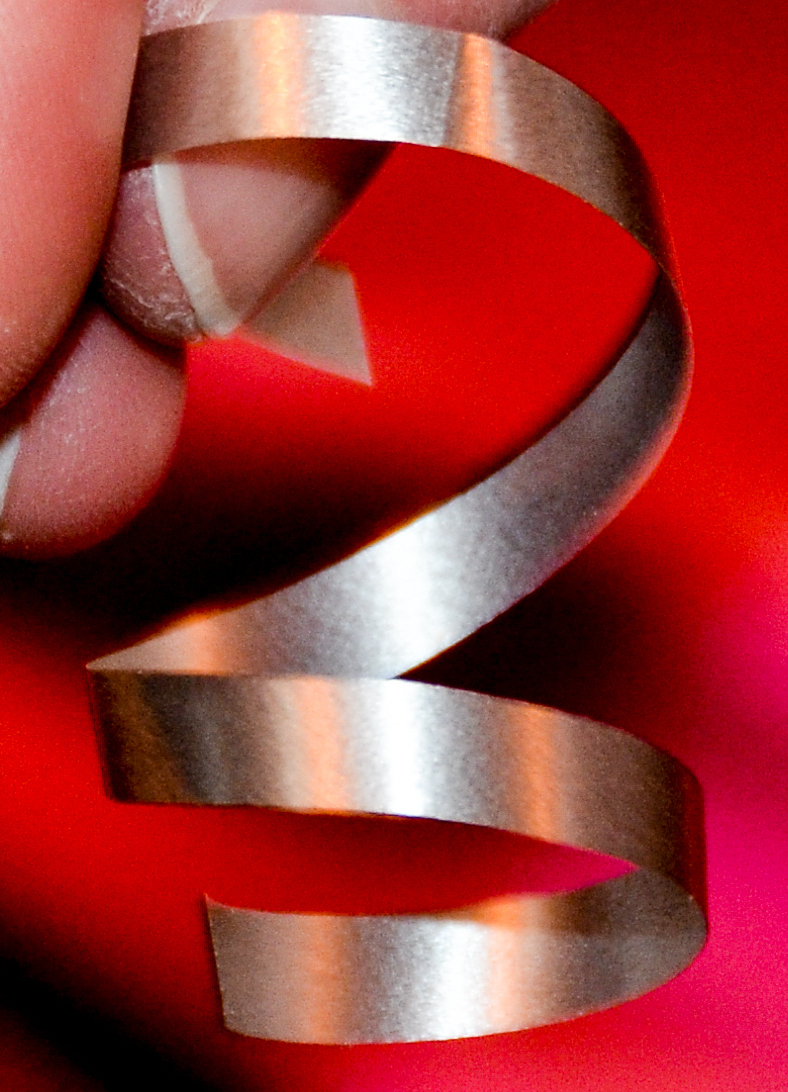
In a research paper from 2106, two of our staff members and their collaborators conducted careful experiments and developed a mathematical model to describe how ribbons curl when they are pulled over a blade: Ribbon curling via stress relaxation in thin polymer films.
The first question to consider is: why does pulling a ribbon over a blade cause it to curl?
The answer is that the finite thickness of the ribbon, typically 100 microns, means that when you bend it over a blade the upper surface stretches more than the lower. If you are having trouble visualising this, think about an athletics track going round a bend: the outside lane is longer than the inside. If you stretch a material far enough then it no longer springs back (the elastic response) and instead holds its shape (plastic deformation). A curl develops when the upper surface of the ribbon is (permanently) stretched more than the lower surface and the diameter of the curl depends on the relative difference in length between the upper and lower surfaces.
The main conclusions from the paper were that the radius of the resulting curl depends on how hard a ribbon is pulled as well as the blade sharpness. Sharper blades give the tightest curls, but pulling too hard or too gently does not curl the ribbon as effectively. If you pull too gently then you don't induce the permanent deformation. If you pull too hard then you stretch both upper and lower surfaces and reduce the difference in length. In addition, the speed at which the ribbon is pulled over the blade plays a significant role.
In order to see whether these effects could be detected when curling ribbon by hand (rather than in a carefully controlled laboratory set-up), we decided to conduct a mass experiment on ribbon curling at the Big Bang Fair in 2016.
Big Bang Fair 2016: The results
We had well over 1000 participants, but not all data were recorded for every participant, so we ended up with just over 900 complete data points. A summary of the data is given below.
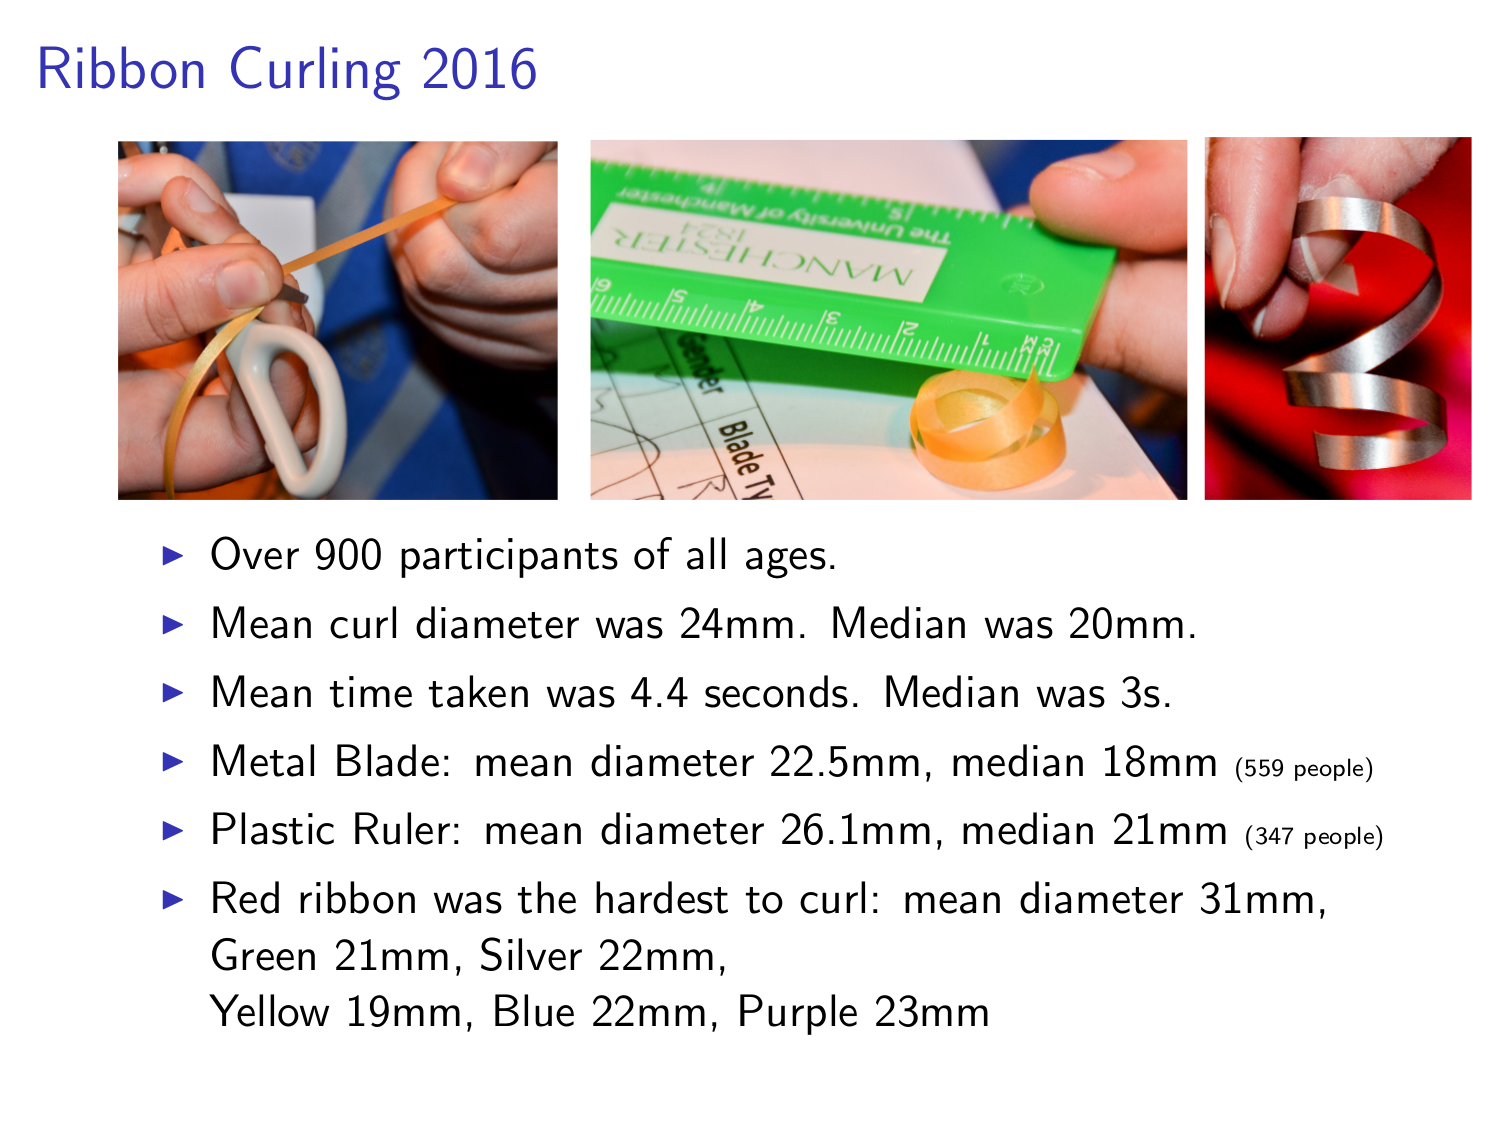
The distribution of curl diameters for all participants is given in the histogram below.
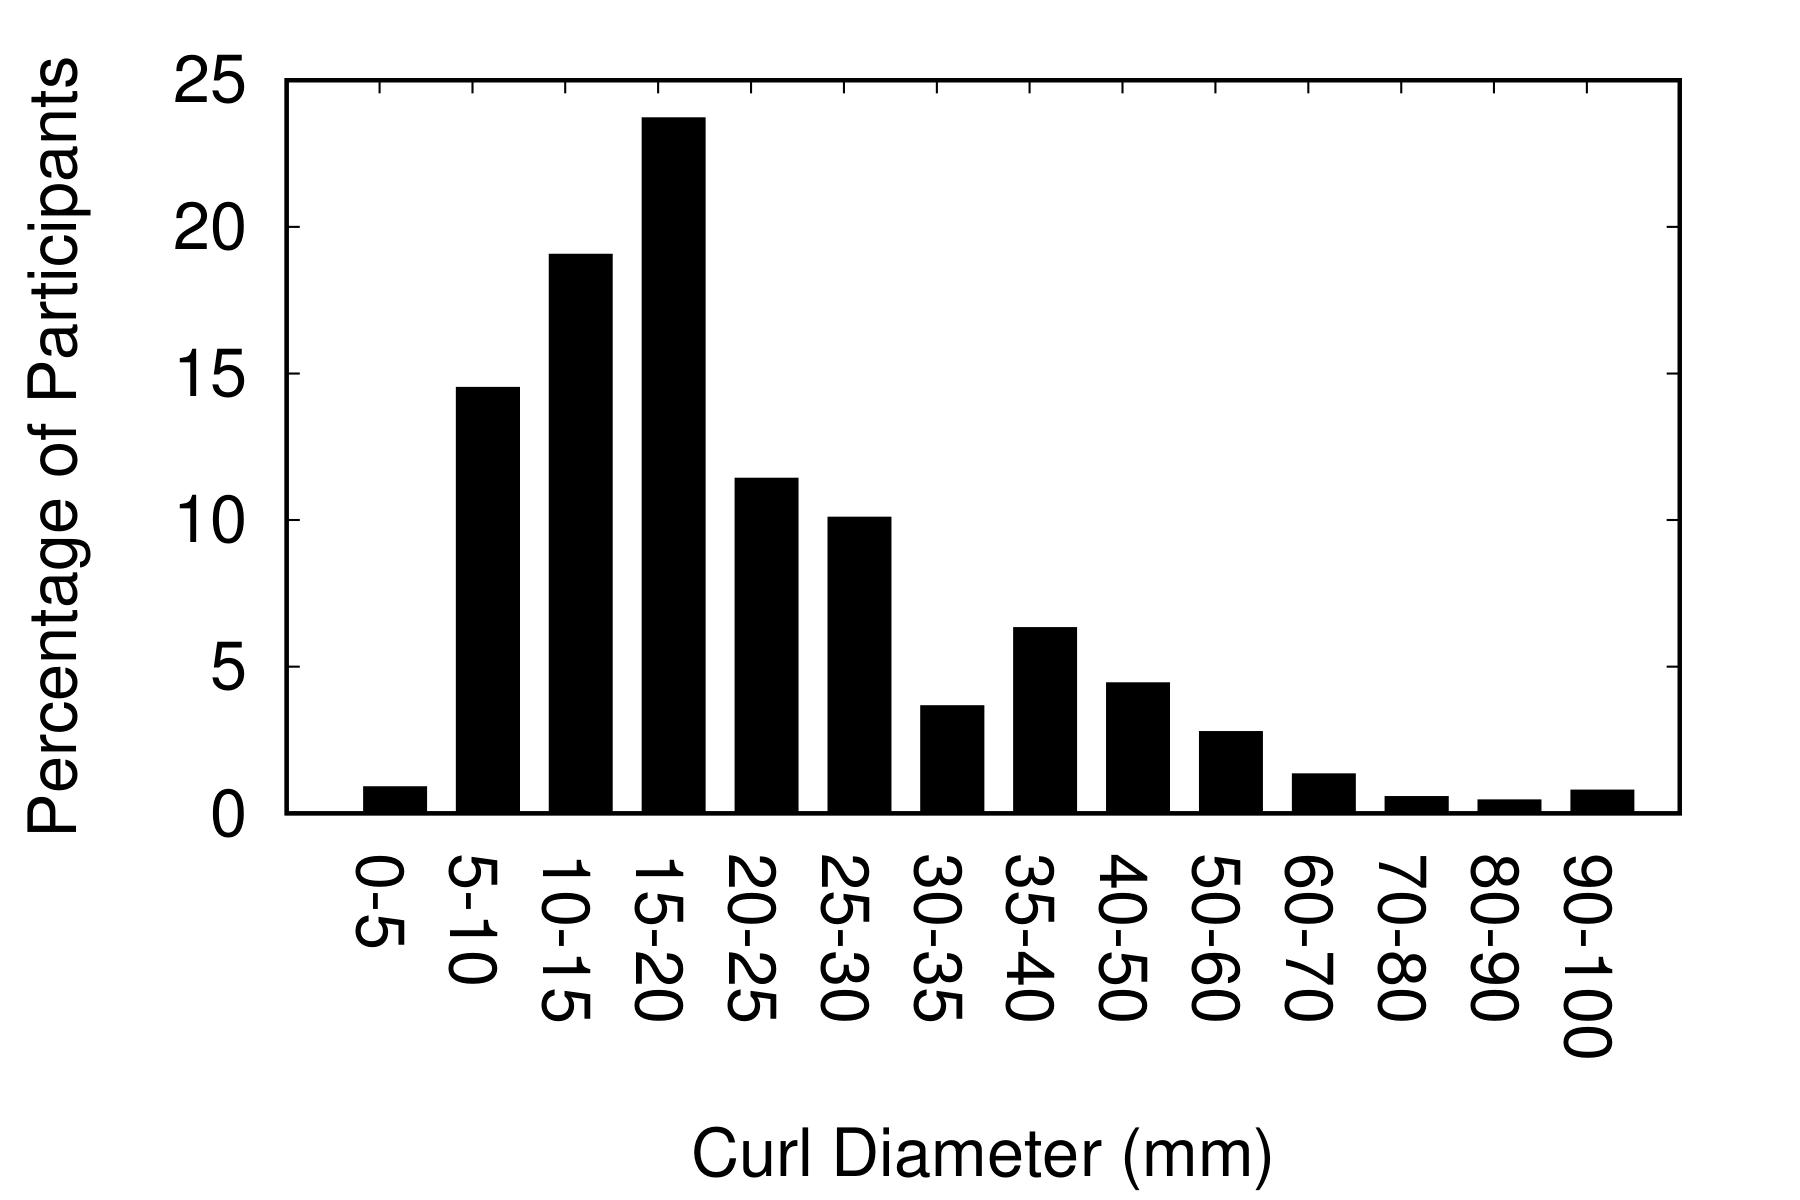
The histogram demonstrates that the majority of participants (approx 60%) produced a curl with a diameter of 20mm (the median) or less.
A box and whisker plot below shows the data grouped by time taken to curl the ribbon. The boxes show the interquartile range and the whiskers the complete range. The data corresponding to 1s represents all those who took 1s or less to curl the ribbon. The data corresponding to 2s represents those who took greater than 1s, but less than or equal to 2s to curl the ribbon. The data corresponding to 11s gathers all those who took over 10s to curl the ribbon.
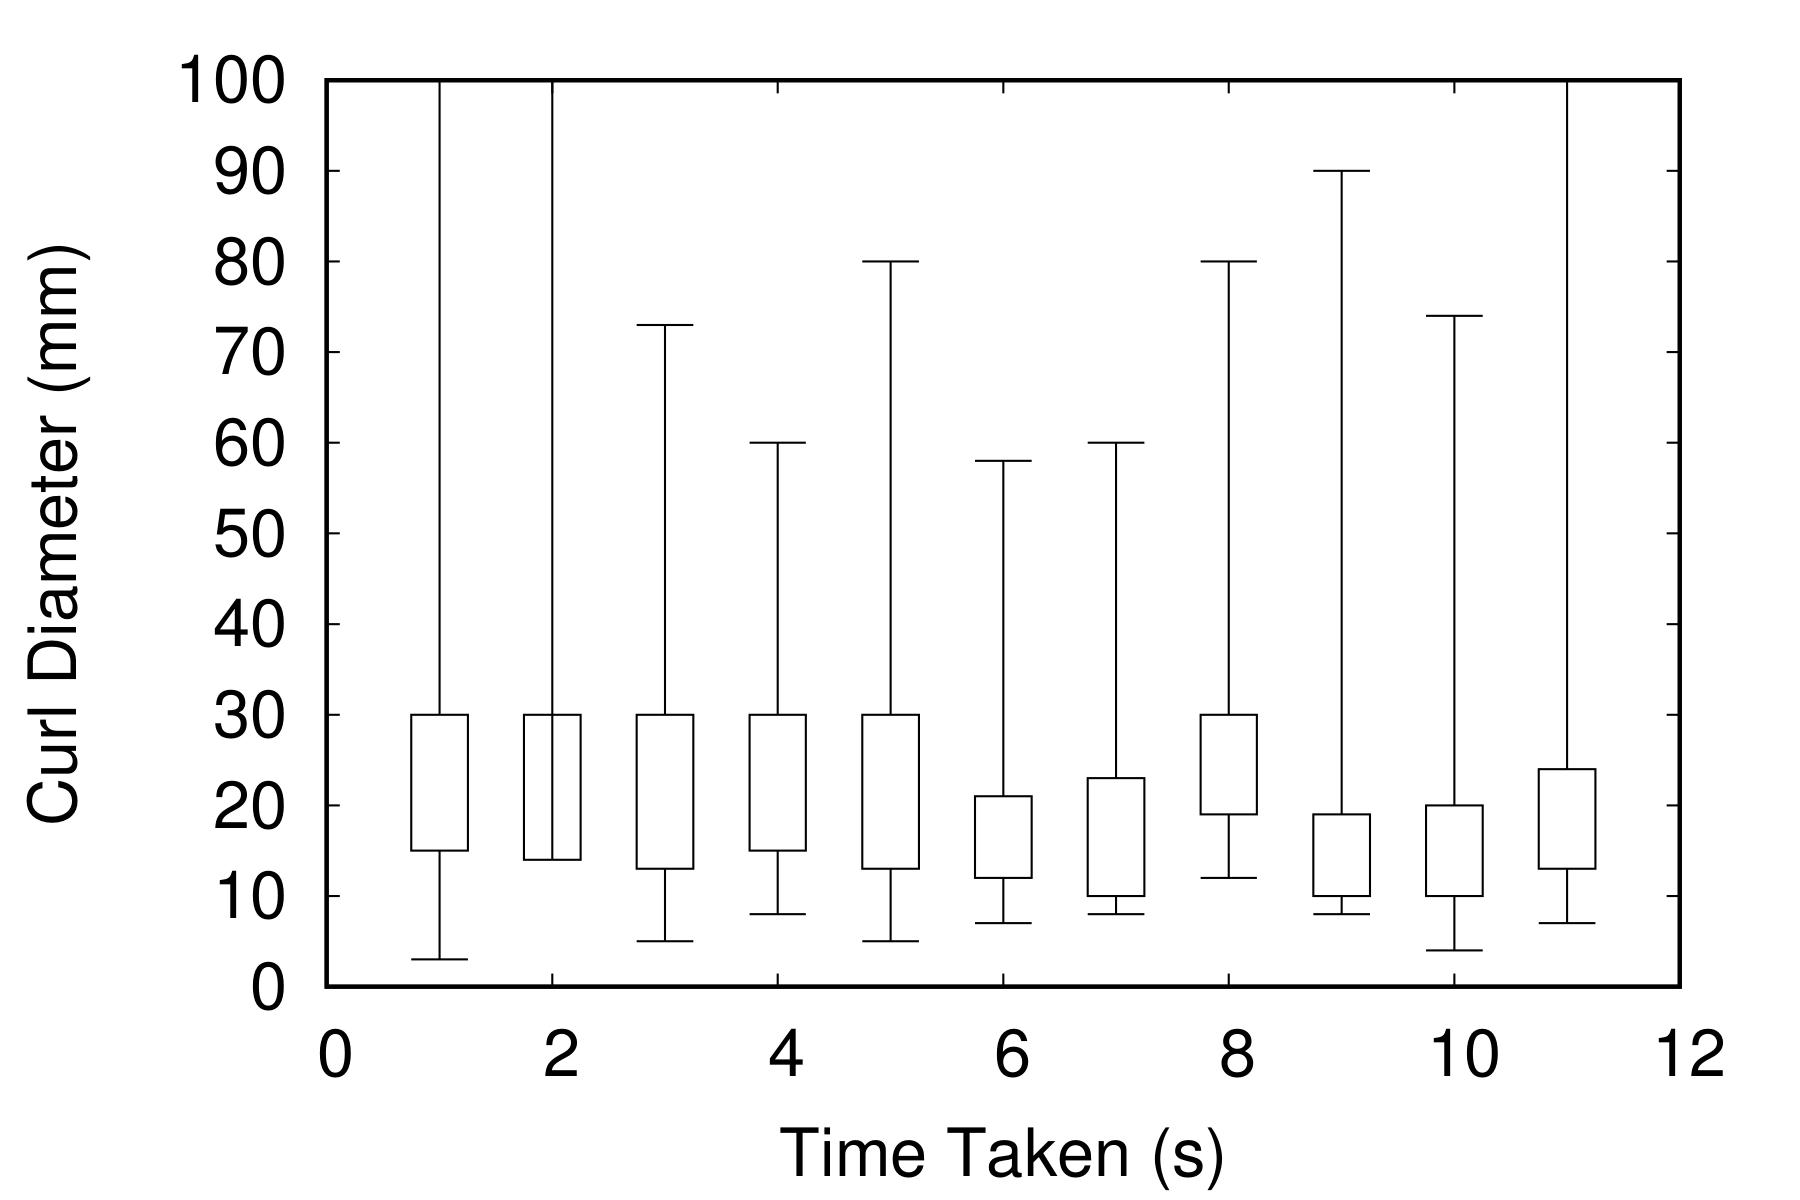
From this data we conclude that time taken to curl the ribbon has little effect on the curl diameter. There is a slight tendency to tighter curls and certainly a smaller interquartile range for longer times (slower speeds). There was a slight difference in mean diameters between those who said they pulled hard (23.2mm) and those that pulled softly (25.2mm), but the median value in both cases was 20mm. There was a greater difference in mean diameters between metal scissors (22.5mm) and plastic blades/rulers (26.1mm). Thus, the trends identified in the mathematical model and controlled experiments do come out of the data from the simple experiment.
You can recreate this experiment simply (and cheaply) in the classroom.
Experimental Apparatus: what you need
The best type of ribbon to use is perhaps unsurprisingly called
Experimental Method: what to do
- Cut the ribbon into lengths of 15mm.
- Curl the ribbon by drawing it up and over the edge, which can take a bit of practice. Note that you can clamp the ribbon by holding it on the side of the scissors, so that you need never put your thumb (or fingers) on the blade.
- Time how long it takes make the curl, so that you can calculate the speed by dividing the length of the ribbon by the time taken.
- Measure the diameter of the curls on the curled ribbon.
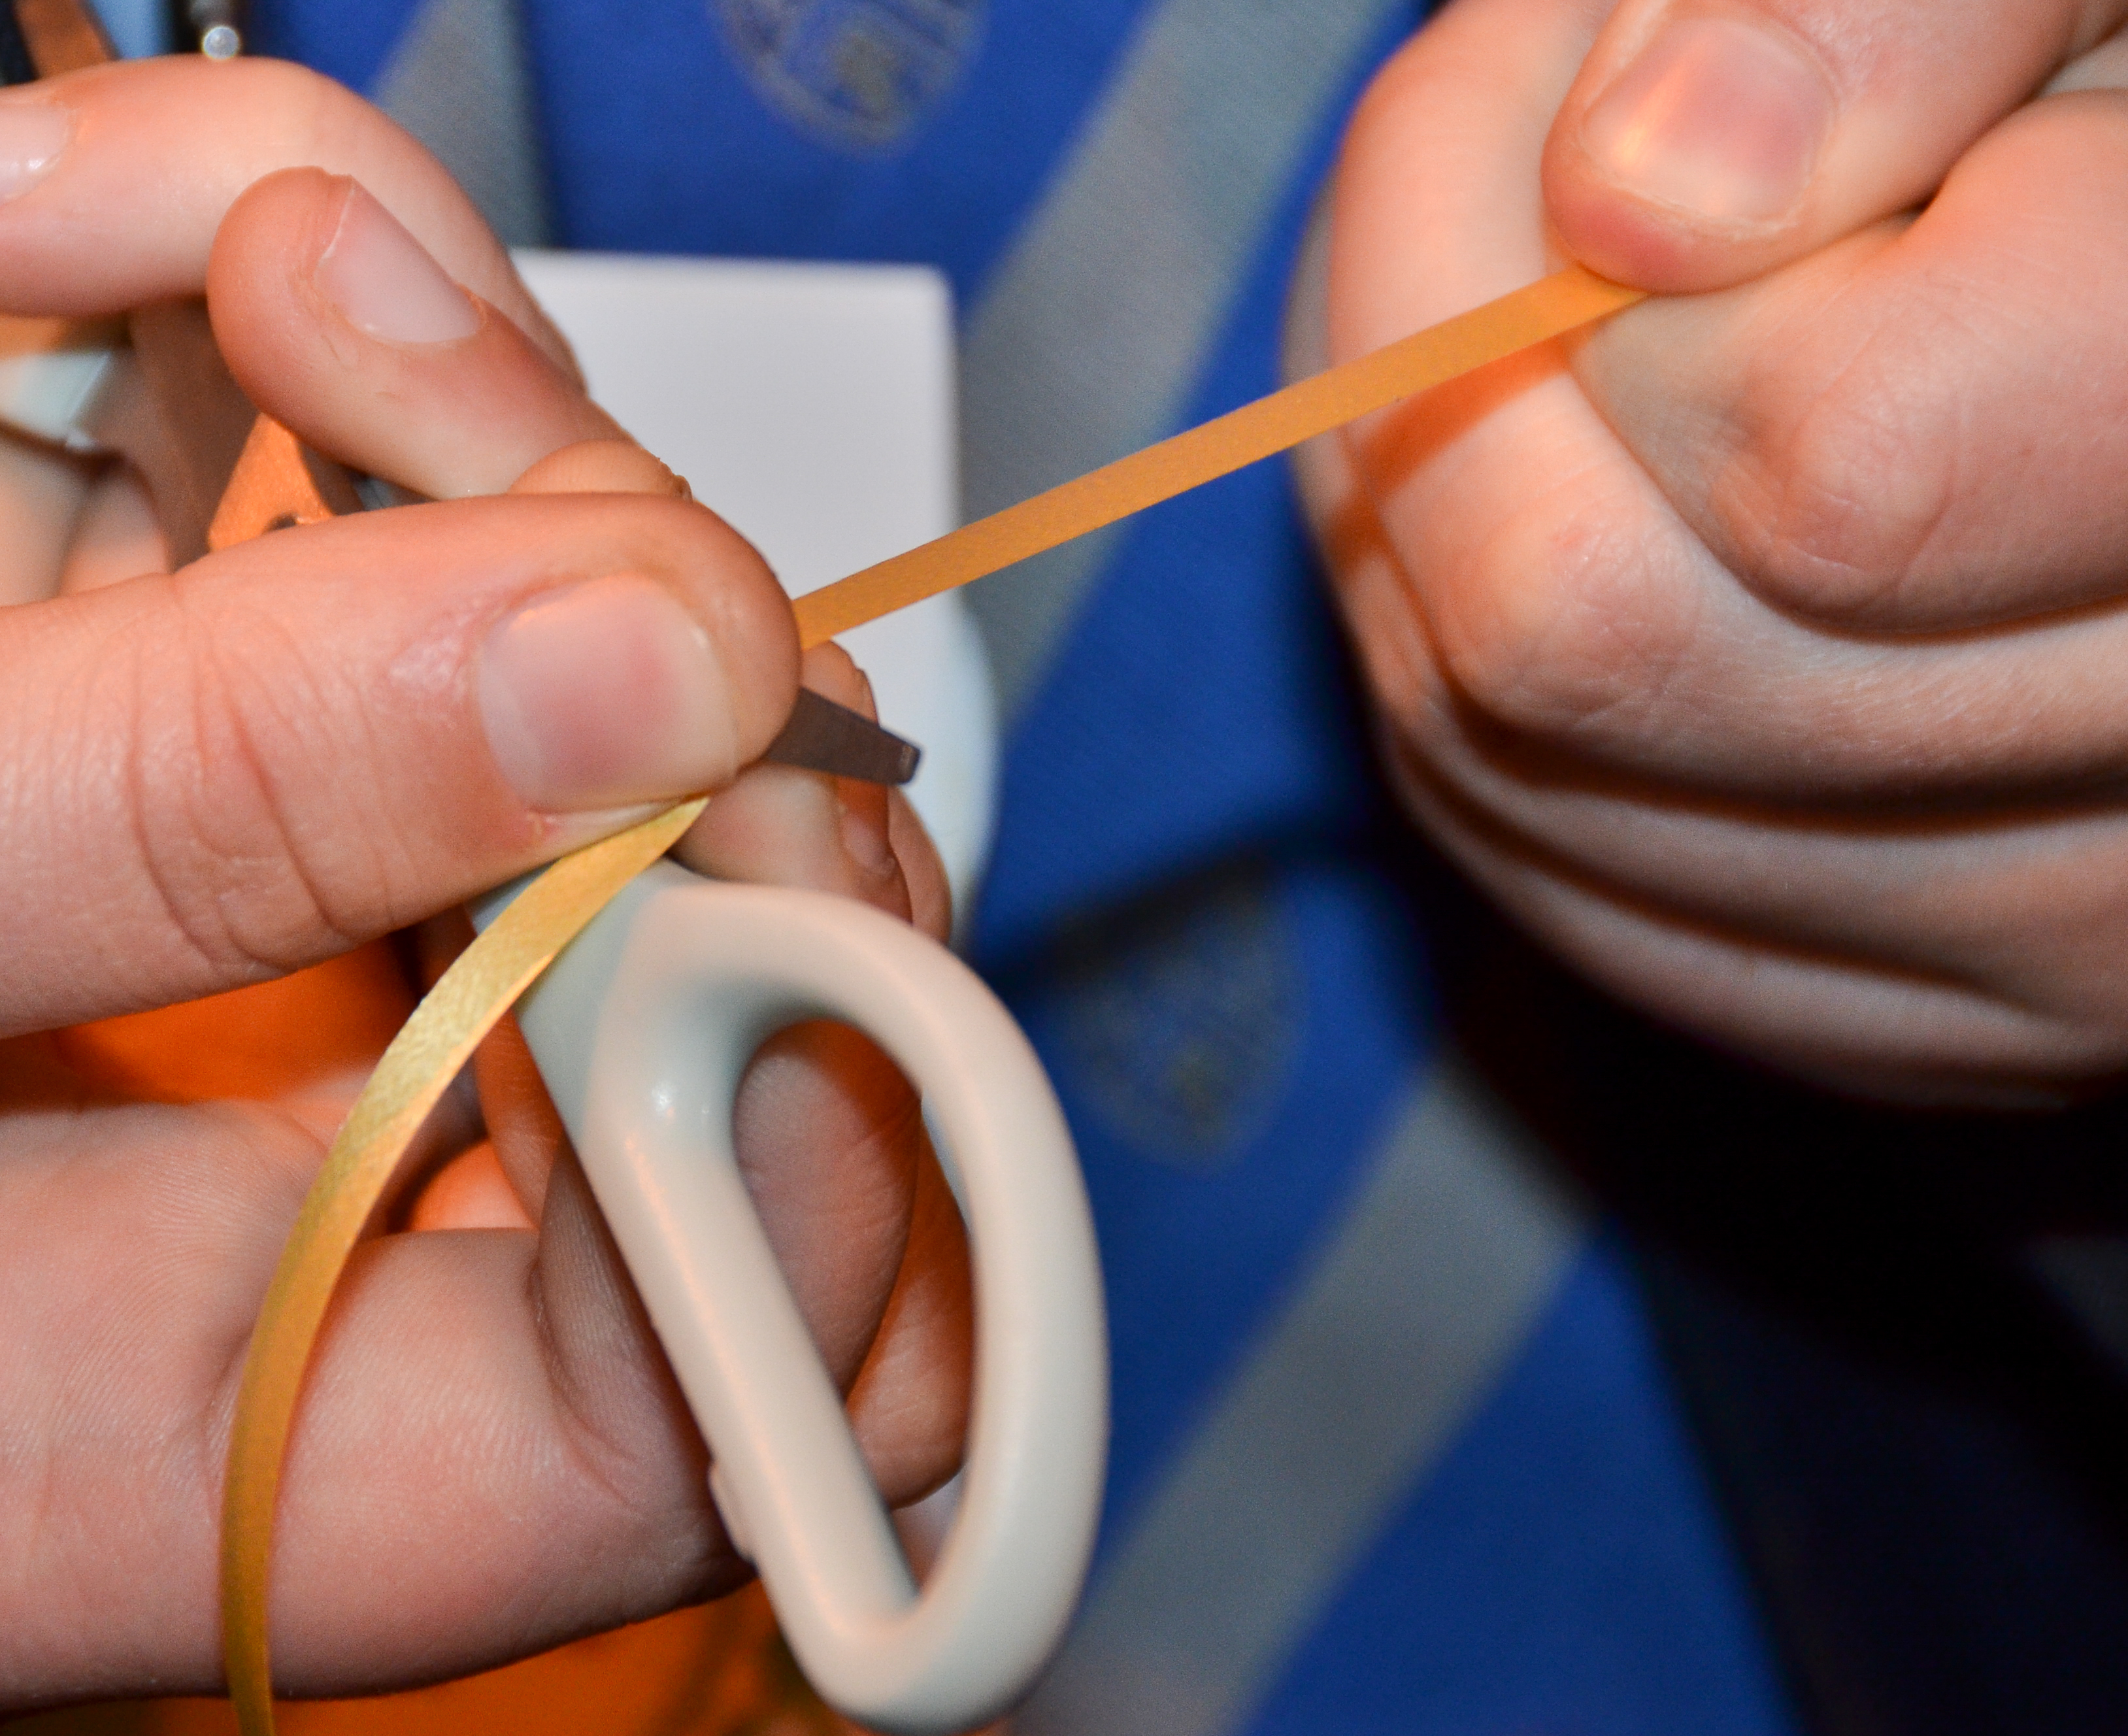
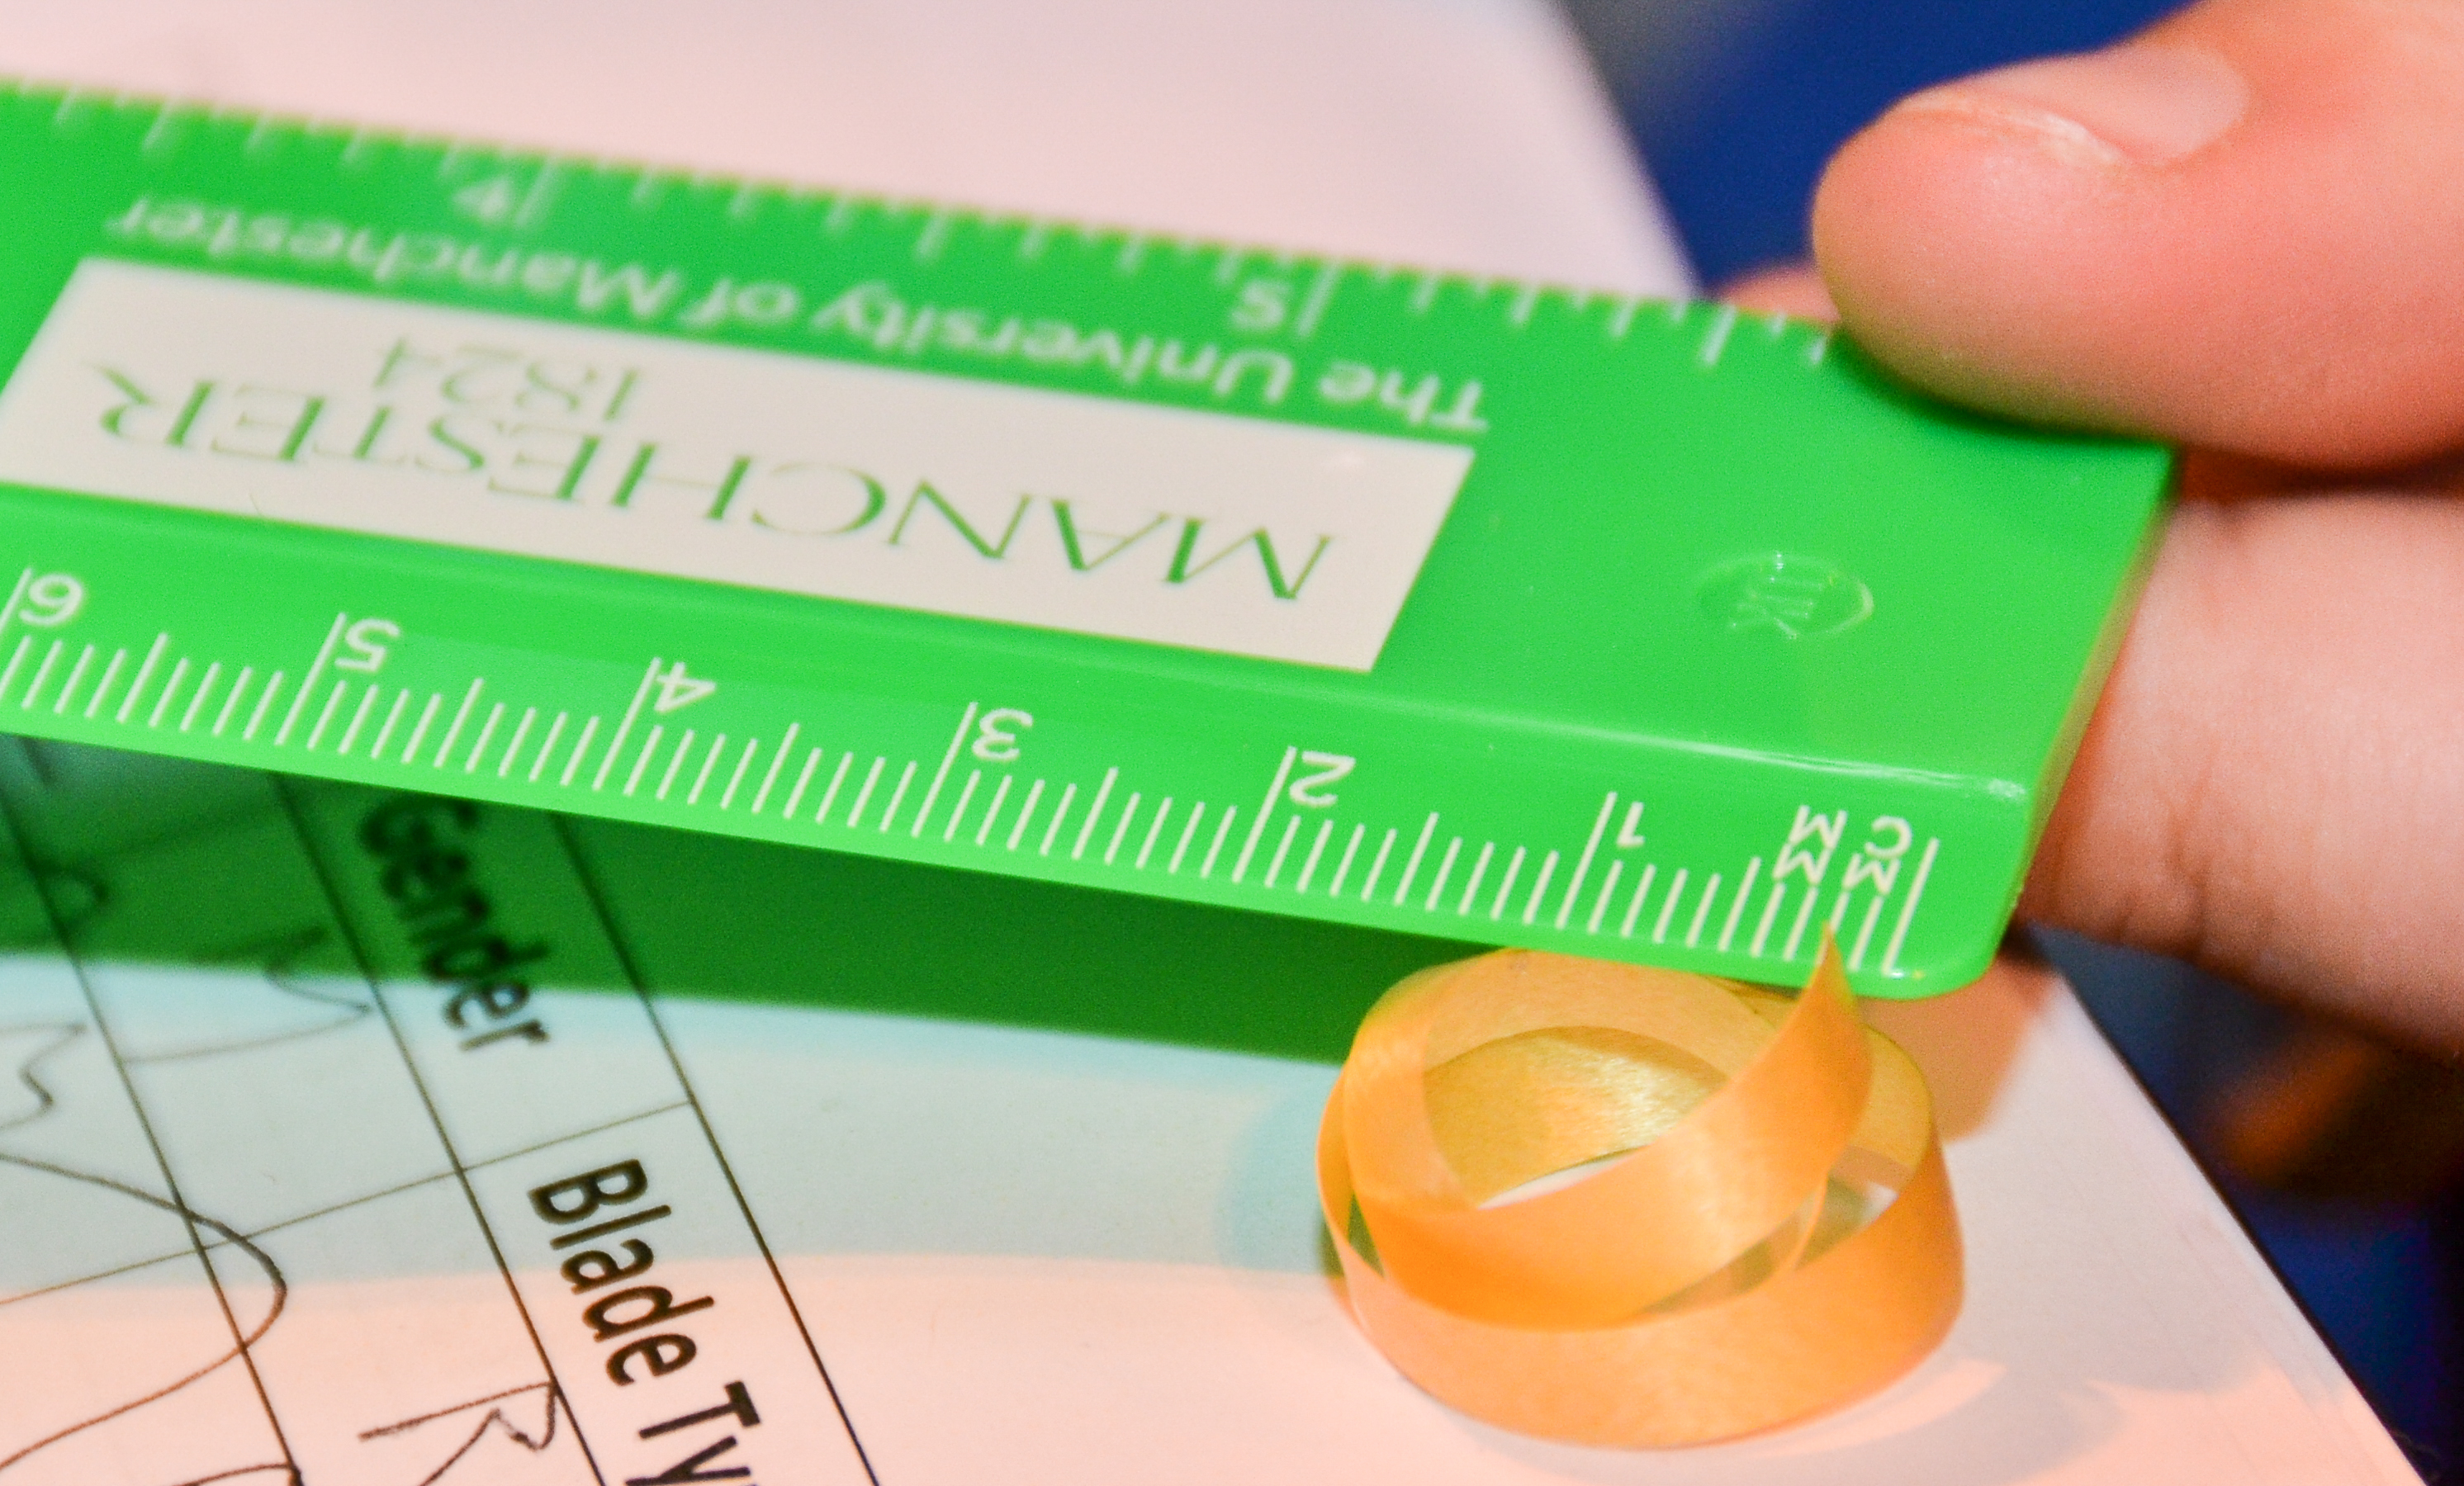
Practical Investigations
There are a number of possible investigations.
- Investigate how the time taken (speed) relates to ribbon curl diameter.
- Investigate whether different colours (types) of ribbon behave differently.
- Try to quantify how the load (how hard you pull) affects the curl diameter. (Force is very hard to quantify accurately unless you start to use force meters which is a more complex experimental setup.)
- Investigate how the curl diameter depends on the number of times that you pass the ribbon over the blade.
Mathematical Exercises
Here are some suggestions:
- Collect data from the entire class and use it to generate histograms and box and whisker plots.
- Compute means, medians and modes for curl diameters? Which do you think is the most appropriate measure?
- Consider hypothesis tests for the difference between means of data collected from metal scissors vs plastic scissors or different types of ribbon.
- For a given thickness of ribbon assumed to have been bent into a circle, work out the relationship between curl diameter (at the midpoint of the ribbon) and difference between inner and outer circumferences.

