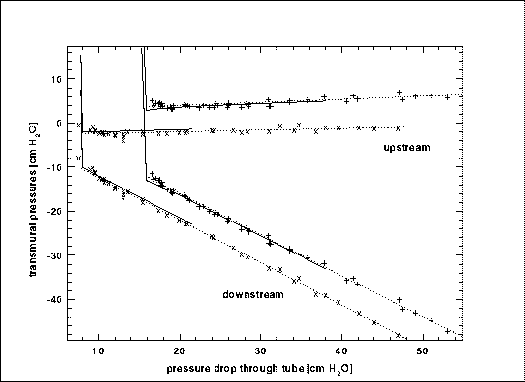
Finally, the figure below presents the flow characteristics of the collapsible tube: The transmural pressure at the tube's upstream and downstream end (upper and lower family of curves, respectively) is plotted against the pressure drop through the tube. The volume flux is held constant along the curves (the curves further on the left correspond to a lower volume flux). The markers (+ and x) represent the experimental data points, the straight dotted lines were obtained by a least square fit to the experimental data and the solid lines are the computational predictions.
