Department of Chemical Engineering
Dr Thomas Rodgers
Department of Chemical Engineering
Dr Thomas Rodgers
Step Five: Checking the output files
|
As soon as the job starts to run a numebr of files are created which contain key information about the simulation. OUTPUT By looking into the contents of OUTPUT, you can check the progress of the simulation. Also, if an error occurs, an error message will appear. Finally, OUTPUT contains information about:
HISTORY Each processing unit will generate a trajectory file with a name beginning with HISTORY. These binary files are the very important as they contain some of the system properties — including an identity number for each molecule — followed by the positions, velocities and virial for each particle in the domain. The HISTORY files can be used with the utility trajects.exe in the DPD/utility directory to produce plottable VMD files, with sets of bonded particles represented as residues. More details will be presented in the analysis section of this tutorial. The utility local.exe in the same directory can calculate localized properties (e.g. temperature, composition, pressure) from the same files and produces VTK files with these properties as cell data. export Every ndump time steps (defined in the CONTROL file), an export file will be generated. This binary file which can be used to restore a stopped DPD calculation. CORREL DL_MESO will generate an ANSI text file containing statistical data which can be imported into a spreadsheet (e.g. excel) or used by graph-plotting software. The data is formatted thus: where t is the time, E energy (tot denoting total, pot potential), P pressure, V volume, T temperature, <rbond> the mean bond length, <θangle> the mean bond angle and <φdihed> the mean bond dihedral. The mean bond angle and dihedral are expressed in degrees. In this particular exercise, the terms in red do not exist, as we do not have charged particles, so no electrostatic interactions are involved, and the 2-bead molecule does not contain angles or dihedrals. Thus, these terms will not be included in the CORREL file produced. You can download the CORREL file and import it into excel. This will allow you to perform calculations, such as the average temperature, pressure or bond length and to plot the time evolution of the energy components. traject.vtf This file is the trajectory of your system in a form that can be visualised using the VMD tool. To obtain this file, you need to use the trajects.exe utility. ~/dl_meso_2.6/BIN/trajects.exe You will then be prompted to enter the number of processors used for the simulation, enter 8. Information will appear on the total number of beads, the number of unbonded beads and the number of frames. You have the option to create trajectories that contain only a group of beads or a limited number of frames for some analysis purposes. Now, you should include all the beads of the system and all the time frames, when prompted to enter these values. While the file is being created, the time steps will be printed on screen, as shown in the figure below: 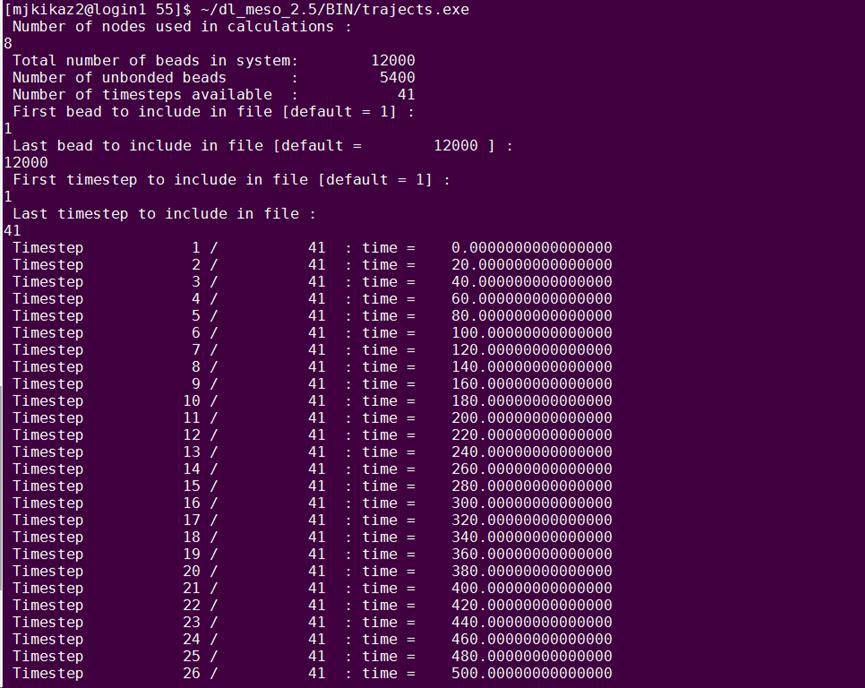
|