Department of Chemical Engineering
Dr Thomas Rodgers
Department of Chemical Engineering
Dr Thomas Rodgers
Running with a Custom Molecule
|
The next exercise will not be presented in detail. You should be able to follow the workflow presented in Example 1 to build a new system. The purpose of this exercise is to guide you through the process of building a system that consists of T-shape molecules of 3 bead species, so only the development of the FIELD file will be shown. It is up to you to perform the simulation and the analysis. This time, you will not use the molecule.exe utility, but you will create the file manually. Go back to your DPD directory and create a folder for this exercise: mkdir EX2 Move to the EX2 directory, open a new file and name it FIELD. This time, the molecule contains 3 bead species; A, B and C bonded in a way that they form a T-shape, as shown in the figure below: 
The initial coordinates of each bead in the simulation box should be chosen carefully to produce a T-shape molecule as in the table below:
This time, there is no solvent in the box. Name your molecule “SURFACTANT” and insert 3000 molecules in the box. As the molecule consists of more than 2 beads, the angle potential should be described in the file, after the bond potential. The equilibrium angles should be such that the molecule maintains its T-shape. The final form of your FIELD file is presented in the figure below. Notice the change in the friction coefficient γ. The format of FIELD should be as in the following figure: 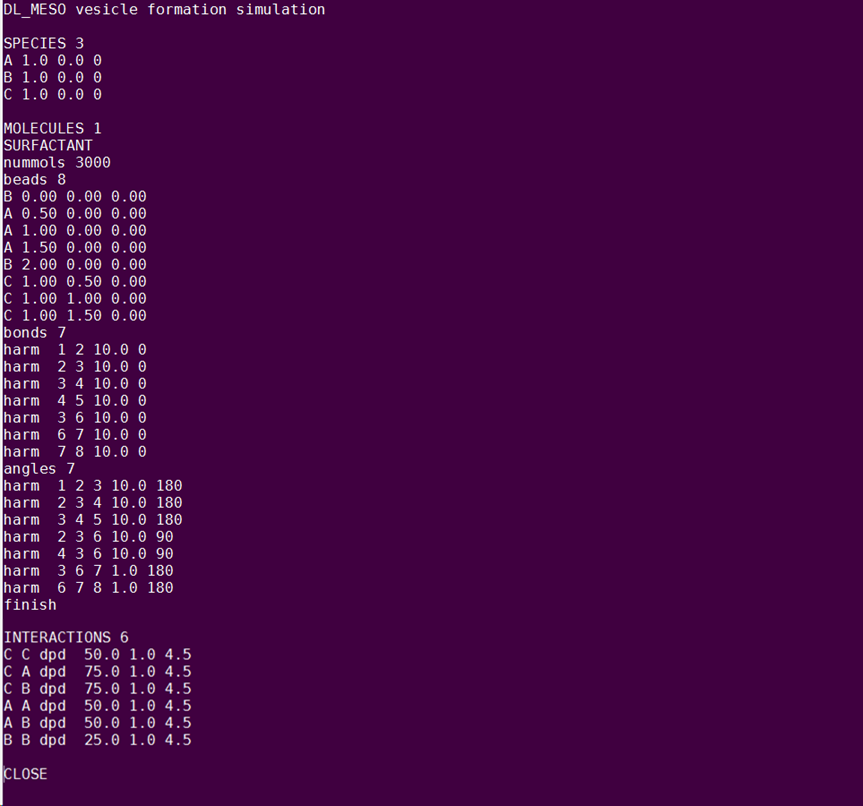
You can copy in your working directory the CONTROL and the script.sh files you used before. You should change the box dimensions in the CONTROL file such that the number density ρ will be equal to 3. Also, increase the number of time steps to run your simulation for longer. Submit your job and repeat the analysis as in exercise 1. Do you observe any pattern in the system structure? You should now be familiar with the DPD basic principles, the DL_MESO simulation package and the VMD visualisation tool. |