Measure a simulated patient’s hearing, plot an audiogram and understand what reaches each cochlea. Use this guide for independent practice, teaching or assessment.
The PTA Simulator helps audiology students learn pure tone audiometry by testing a simulated patient and finding their hearing thresholds. It is especially useful for asymmetric hearing losses where masking is required. Tutors can prepare and share customised patients; students can also create their own cases for practice. The same system can be used independently as an audiogram plotting tool.
What you can do
Practise audiometry: test both ears using AC and BC, observe patient responses, and record thresholds or no-response results.
Explore masking: simulate cross-hearing and cross-masking, inspect cochlear sound pathways with Visual helper, plan with Masking helper and record searches on the Masking chart.
Practise immittance testing: fit probes, measure tympanograms and acoustic reflexes, and recognise noisy ART recordings caused by simulated probe-fit problems.
Create patients: set cochlear thresholds, conductive components, AC interaural attenuation, BC transmission and response variability manually, or generate cases with Tutorial.
Review your work: compare the audiogram with the patient’s expected results, check measurement method and timing, and inspect/export the presentation log.
Plot and explain results: use UK/NZ symbols, masked and not-masked series, shadows, ULL data, annotations and ISO 7029 age / ISO 1999 noise reference contours.
Save and share: copy patient and audiogram links, export annotated PNGs, and download presentation CSVs. Assessment links restrict teaching aids while retaining measurement and documentation tools.
Find your way around
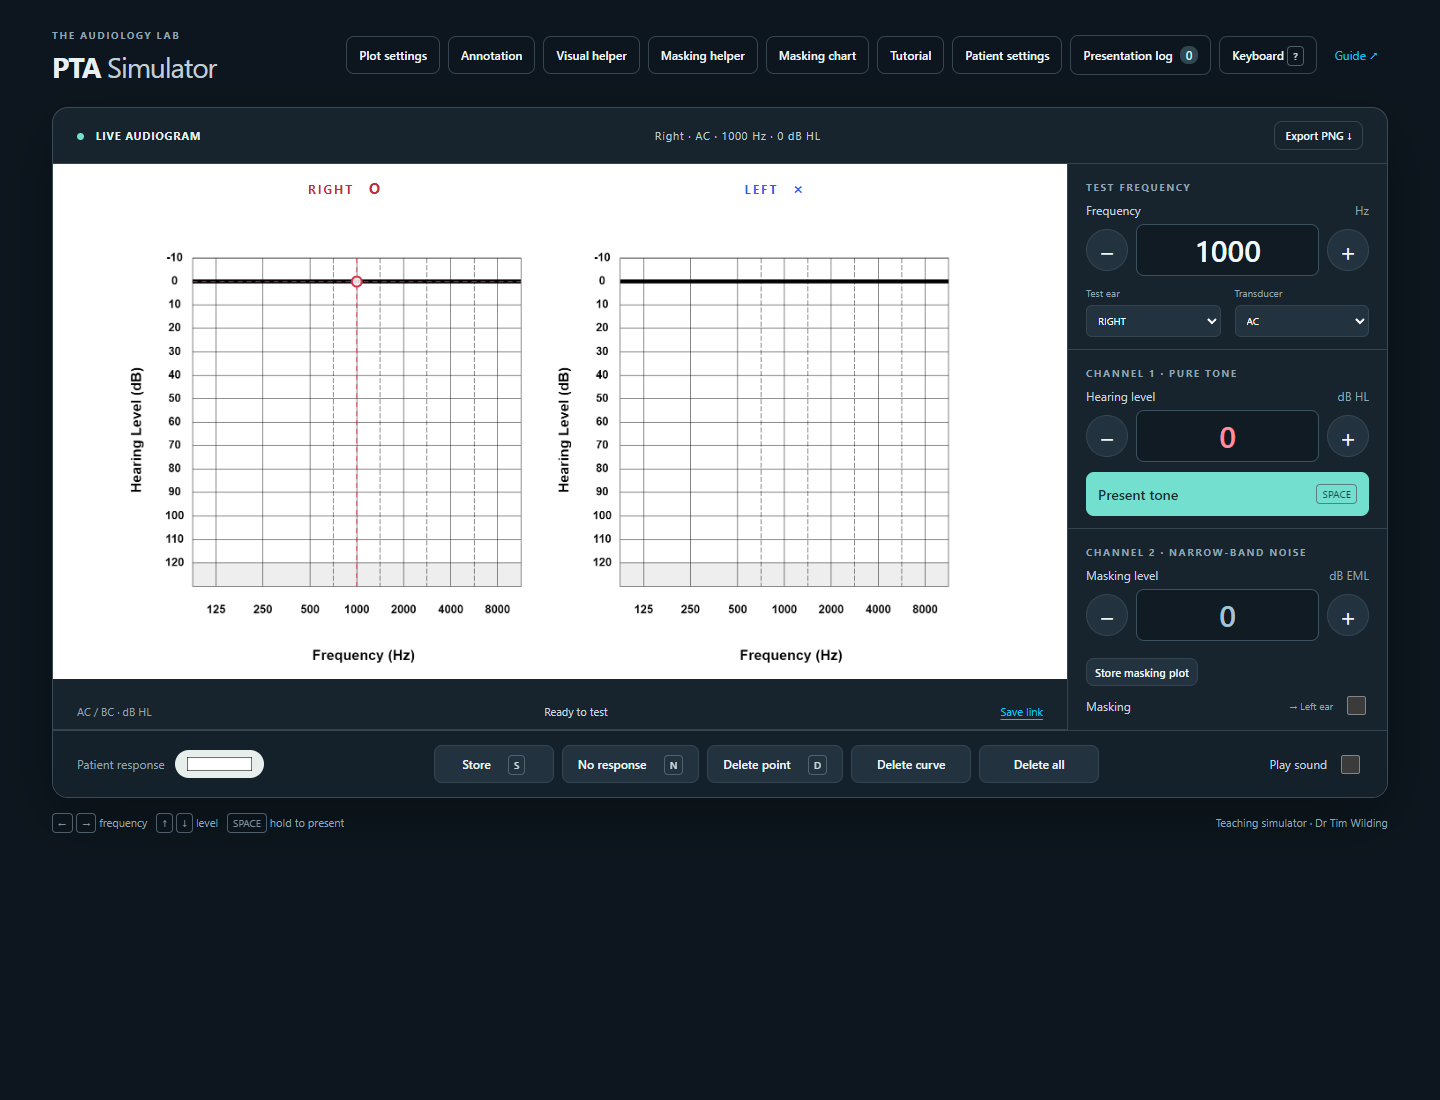
The audiograms stay visible above the instrument. The menu opens settings or teaching tools. Below the plots, select frequency, pure-tone level and masking level. The patient response light shows whether the simulated patient responded. The crosshair marks the selected ear, frequency and tone level; it is not a stored threshold.
The current simulator workspace. Select image to enlarge.
Open the case link supplied by your tutor. For independent practice, open the plain simulator and create a patient using Tutorial or Patient settings. Keep this guide open beside your testing window.
01 / Measure and record a threshold
Choose the test conditions. Select Test ear, AC (headphones) or BC (bone conductor), and frequency. For initial not-masked testing, turn masking off. Fit the transducers using Patient setup before presenting sound. The masker uses the AC output opposite the selected test ear; its physical placement determines which ear receives it.
Familiarise the patient. Set an appropriate starting level and hold Present tone with the pointer, or hold Space. Release to stop. Allow for the simulated 0.4–0.6 second response delay. Play sound may stay off: responses and logging still work.
Search for threshold. After a response, reduce by 10 dB; after no response, increase by 5 dB. Repeat ascending approaches to the same level. The method checker recognises two responses in two, three or four ascending presentations at that level. One response is not confirmation.
Store the result. Set Channel 1 to the confirmed threshold and select Store or S. Store records the selected level, ear, frequency, transducer and masking category; it does not decide whether your threshold is valid. Use No response or N to record a no-response result at the appropriate output limit.
Continue, then mask where required. Complete the relevant AC/BC measurements, identify cross-hearing risks and remeasure with masking. Store the final masked threshold with masking active and a numeric masker level selected.
Fit the transducers in Patient setup
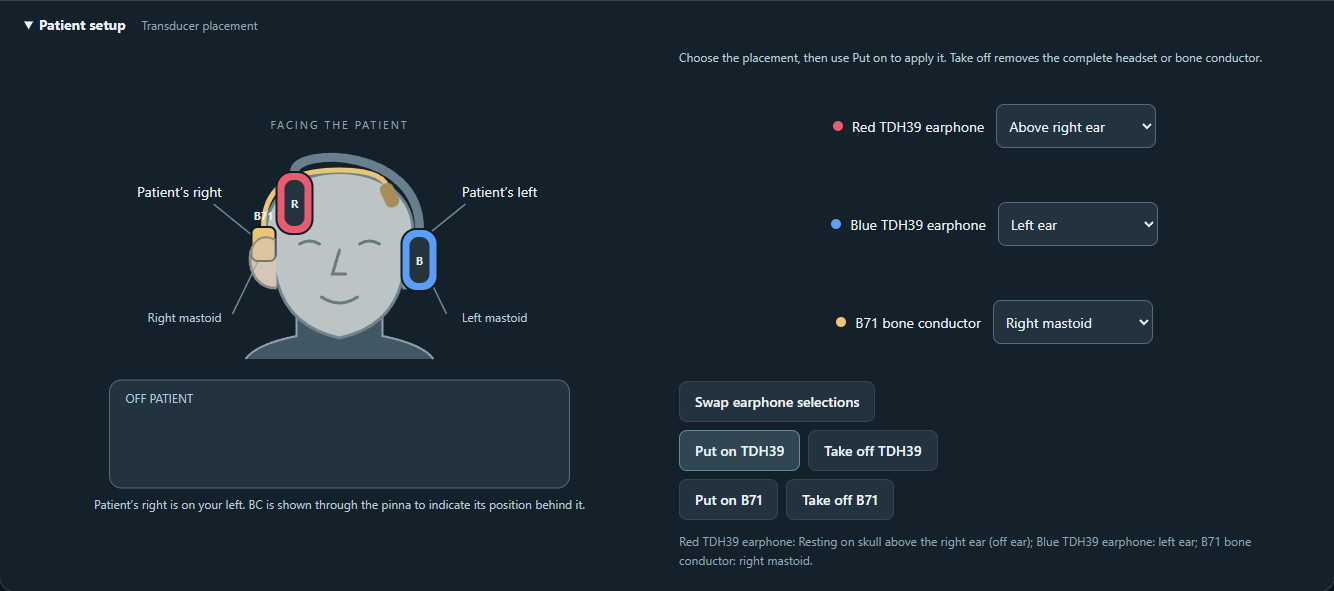
Patient setup sits below the patient response bar. The diagram faces the patient: their right is on your left. All transducers start off the patient, with blank placement selections.
Choose the TDH39 positions. Select where the red or blue earphone will sit; the other selection adjusts to the opposite side. Either colour can be placed over either ear, or one earphone can rest above an ear while its partner covers the other. Swap earphone selections reverses the selections.
Apply the headset. Select Put on TDH39 to apply the chosen positions. Changing a selector alone does not move a fitted transducer. Take off TDH39 removes the complete headset.
Apply the bone conductor. Choose the left or right mastoid behind the pinna, then select Put on B71. Take off B71 removes it. An AC earphone cannot cover the same side as the fitted BC conductor; a placement conflict shows a message.
A BC masking arrangement: BC on the right mastoid, the opposite ear covered, and the unused earphone above the test ear. Select image to enlarge.
Placement and signal selection are separate. Channel 1 selects the output: Right uses the red AC earphone and Left uses the blue. Masking uses the other AC earphone. Their actual placement determines where the sound reaches the patient. Fitted BC stimulates both cochleae; the selected test ear still determines which AC output supplies masking. Incorrect or off-patient placement affects responses and is reviewed by Check method. Off-patient transducers and earphones above an ear use an estimated 40 dB extra loss; the conductive component on each side still applies to this air route.
For BC masking, fit the BC conductor on the test side and an AC earphone over the opposite ear. Recheck the BC threshold with the masker off before starting masking. If the patient has a non-zero BC occlusion setting, covering an ear increases the BC signal reaching that cochlea, even while the masker is off; an earphone resting above an ear does not cause occlusion.
The testing sequence recognised by Check method
Initial AC: 1000, 2000, optional 3000, 4000, optional 6000, 8000, 500 and 250 Hz. Retest 1000 Hz on the first ear before switching ears. Better-ear choice is reviewed using mean AC at 500, 1000 and 2000 Hz; the checker does not penalise an initially unknown better ear.
With no prior result, the checker expects AC familiarisation at 40 dB HL. With a reference, it expects reference + 30 dB, capped at 80. Familiarisation rises by 10 dB up to 80, then by 5 dB until a response, within output limits. Retests use the same-frequency result; new frequencies use the preceding available result in the prescribed sweep, with 1000 as the reference for 500 and 500 for 250.
Initial BC: 1000, 2000 and 500 Hz on one side, chosen by the worse AC mean at these frequencies (either side on a tie). Its familiarisation reference is the better AC at the test frequency + 30 dB, capped at 80. These describe this simulator’s teaching checks; follow your tutor’s instructions for the exercise.
Present tones for 1–3 seconds and vary their duration and spacing. ISI is measured from one tone ending to the next starting. Gaps below one second are flagged; longer thinking pauses are distinguished from rhythm sequences. Duration variation is assessed across the session, excluding familiarisation tones, so short threshold searches can contribute to the same check. Longer searches are also checked for limited variation within their own block. Timing feedback is a teaching heuristic.
Keyboard and pointer controls
Key
Action
Space
Hold to present; release to stop.
← / →
Previous / next frequency.
↑ / ↓
Tone −5 / +5 dB; crosshair up / down.
Shift + ↑ / ↓
Masker −5 / +5 dB.
L / R, B, M
Select ear; switch AC/BC; toggle masking.
S, N, D
Store threshold; store no response; delete selected point.
?, Escape
Open keyboard help; close a settings dialog.
Shortcuts work outside editable fields and settings dialogs. Tab reaches controls. After editing a main dropdown, Enter or Escape returns to testing. Touch and pointer users can use the same buttons and selectors. Opening a settings dialog or losing window focus stops a held tone; showing a helper dock does not.
Correct a stored result
Delete point removes the selected ear/frequency/category, including its no-response variant, regardless of current tone level. Delete curve clears the selected ear’s current curve and applicable shadows. Delete all clears both ears’ PTA points and PTA annotations. Patient settings, the presentation log, ISO overlays and the separate masking chart remain.
AC curve deletion clears AC and its not-masked shadow; in NZ mode, not-masked AC deletion clears only the not-masked series. Masked BC deletion also clears its not-masked BC shadows; not-masked BC deletion clears only not-masked BC. A masker value of OFF selects the not-masked category even if the masking switch is on.
Three tools for learning masking
A response to a tone presented to one ear may originate in the other cochlea. Masking raises the non-test cochlea’s apparent threshold so you can establish the test ear’s threshold. Excessive masker can cross to the test cochlea too. These tools support different parts of the process and can remain open while testing.
Visual helper — understand the pathways
Select Visual helper to open a live dock. Compare the tone and masker reaching each cochlea with its apparent threshold, then observe which cochlea responds. The main patient response light combines responses; it cannot tell you which cochlea heard the tone.
The Visual helper exposes the sound pathways. Select image to enlarge.
With zero conductive loss and 40 dB AC interaural attenuation, a 40 dB HL tone in the right ear reaches the right cochlea at 40 and the left at 0. A 50 dB EML masker in the left ear reaches the left at 50 and crosses to the right at 10. Actual patient settings may differ.
Ascending trials shows responses/presentations by level. Only a tone higher than the preceding presentation in the same context counts; first, equal-level and descending presentations do not. Green counts highlight 2/2, 2/3 and 2/4. Delayed responses can contribute. Start level records the first presentation in that context.
With both BC attenuation settings at their default 0 dB, the same BC tone level reaches both cochleae regardless of the selected test side. Independent BC attenuation can change those levels. A conductive component reduces an AC tone or masker reaching the same-side cochlea; the cross pathway is controlled separately by AC IA. Apparent threshold reflects the cochlear baseline raised by any effective masking at that cochlea.
Changing ear, AC/BC, frequency or masker state/level resets these displays. Counts accumulate while the dock is hidden and never store a threshold automatically. This tool is disabled in assessment mode.
Masking helper — identify and check your plan
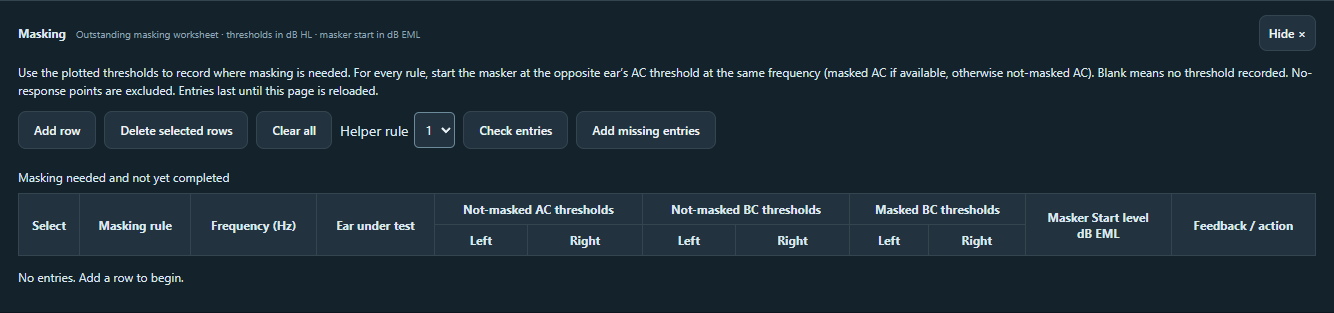
Select Masking helper, choose a rule and add/edit worksheet rows. Record frequency, ear under test and relevant plotted thresholds, then enter Masker Start level, dB EML. The helper reads the audiogram, not hidden patient thresholds.
App rule
Requirement
Rule 1
Not-masked AC differs between ears by at least 40 dB: mask the worse ear’s AC test.
Rule 2
Effective AC is at least 10 dB worse than not-masked BC: establish ear-specific BC where still unresolved.
Rule 3
AC is at least 40 dB worse than opposite-ear BC where Rule 1 does not already apply.
Add missing entries adds outstanding rows for the selected rule and fills new starting masker values from opposite-ear AC at the same frequency, using masked AC if available. Existing answers stay intact. Check entries checks existing rows and reports missing requirements for the selected rule. Delete individual/selected rows or clear the worksheet as needed.
Complete initial measurements before planning masking. Select image to enlarge.
For every rule, the expected start is the non-test ear’s effective AC threshold in dB EML. Blank and no-response points cannot supply a numeric start. Completed masked results remove matching outstanding rows. Not-masked BC can belong to either cochlea; masked BC helps resolve that ambiguity. These fixed rule checks do not replace a plateau search or cover every patient-specific IA. The worksheet is session-only and disabled in assessment mode.
Masking chart — document the plateau search
Obtain an initial threshold and a full masker-off recheck.
Set the first masker to the opposite ear’s effective plotted AC threshold. Turn Masking on and select a numeric level: OFF is not effective masking.
Find and confirm the tone threshold at that masker level. Set Channel 1 to the result and press Store masking plot in Channel 2.
Increase masker by 10 dB, perform a full threshold search, and store a chart point at each level. The checker expects at least four masker-level measurements, with the final three thresholds within 5 dB.
Once you establish a plateau, record the final PTA threshold separately using Store.
Use the previous threshold + 30 dB, capped at 80, for familiarisation at the next masker level. Confirm thresholds through ascending trials rather than simply copying a previous result.
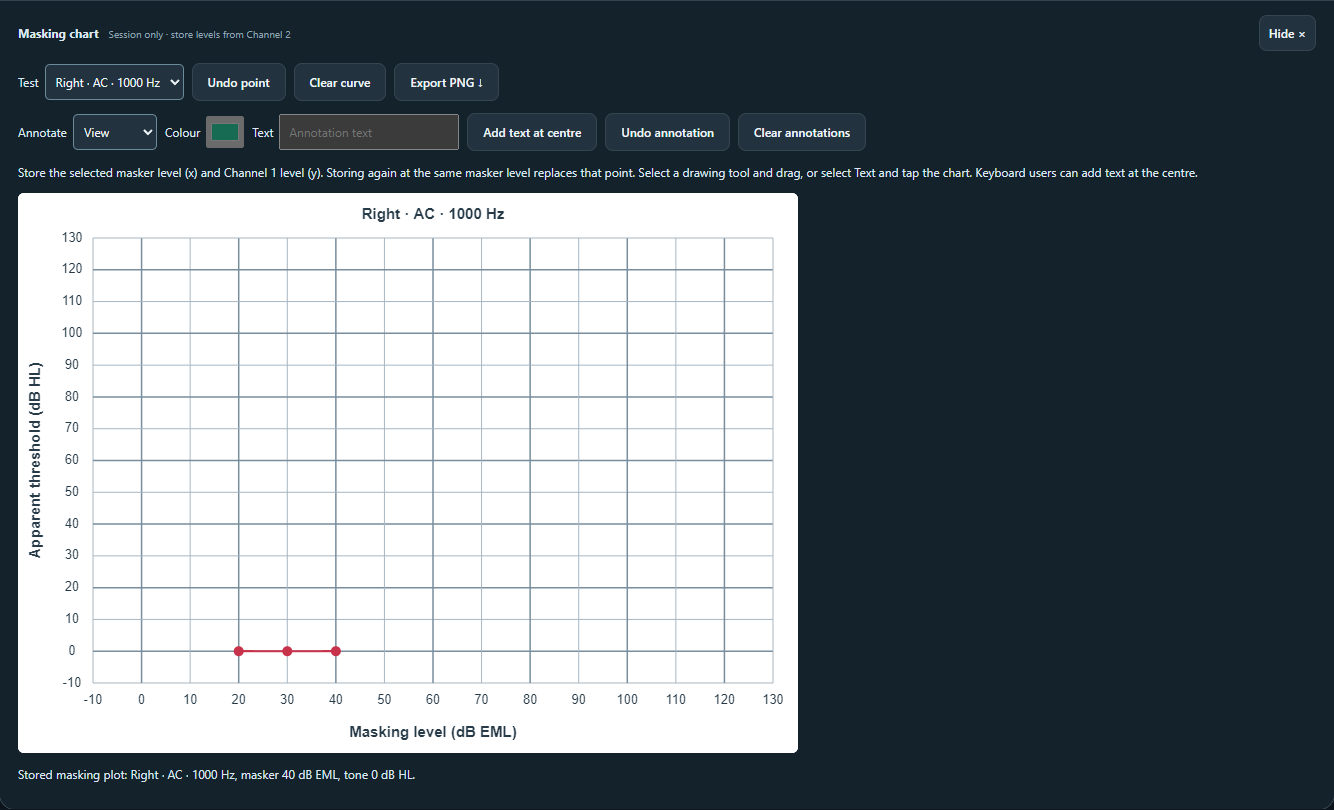
Select Masking chart to view the graph: x is masker level (dB EML), y is tone level (dB HL). Curves are separate by ear, frequency and AC/BC. The curve selector reviews earlier work without changing instrument controls. Repeating a masker level replaces its point; Undo point can reverse replacements and clears.
Illustrative stored control values; a flat graph alone does not prove properly measured thresholds. Select image to enlarge.
Annotate using freehand, line, arrow or text. Enter text then choose Add text at centre for keyboard placement. Point and annotation undo/clear controls are separate. Export PNG saves the selected curve and notes. The chart is available in assessment mode; curves and annotations are session-only.
Some patients have no achievable plateau because of cross-masking or output limits. Do not substitute a no-response threshold for a masking dilemma. Method review can explain supported limitations after the available masker range is exhausted; stopping earlier may leave the series incomplete. Loudness comfort is not modelled.
02 / Create a case, test it, then reflect
Students can create their own patients in Tutorial on an unrestricted page. Start simply, then change one feature at a time to connect the audiogram with the sound pathways.
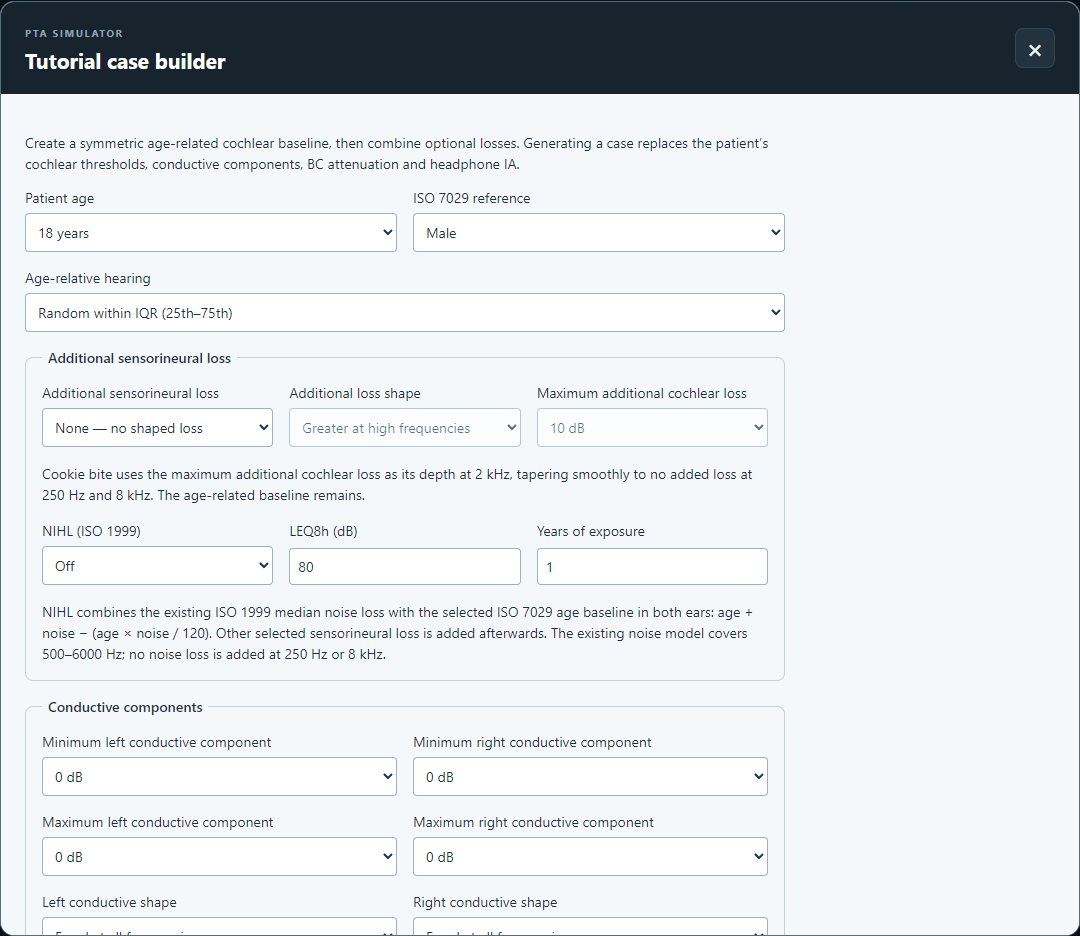
Tutorial generates a patient. Plotting and checking are separate actions further down the dialog. Select image to enlarge.
Generate a patient. Choose age, ISO reference and age-relative hearing. Add losses as needed, then select Generate and set patient. This replaces cochlear thresholds, conductive components, BC attenuation and AC IA; existing plotted work and other response settings remain.
Prepare a clean attempt. Save work you need, close Tutorial, then Delete all unwanted PTA points. Reset the presentation log before a fresh method attempt. Clear the separate masking worksheet/chart if you need fresh notes.
Measure without revealing the answer. Hide Visual helper when relying only on the response light. Perform and store AC/BC measurements and required masking.
Check result and procedure separately. Reopen Tutorial, select the relevant Thresholds to plot or check mode and use the two checks below. Neither check alters your plot.
Check current audiogram
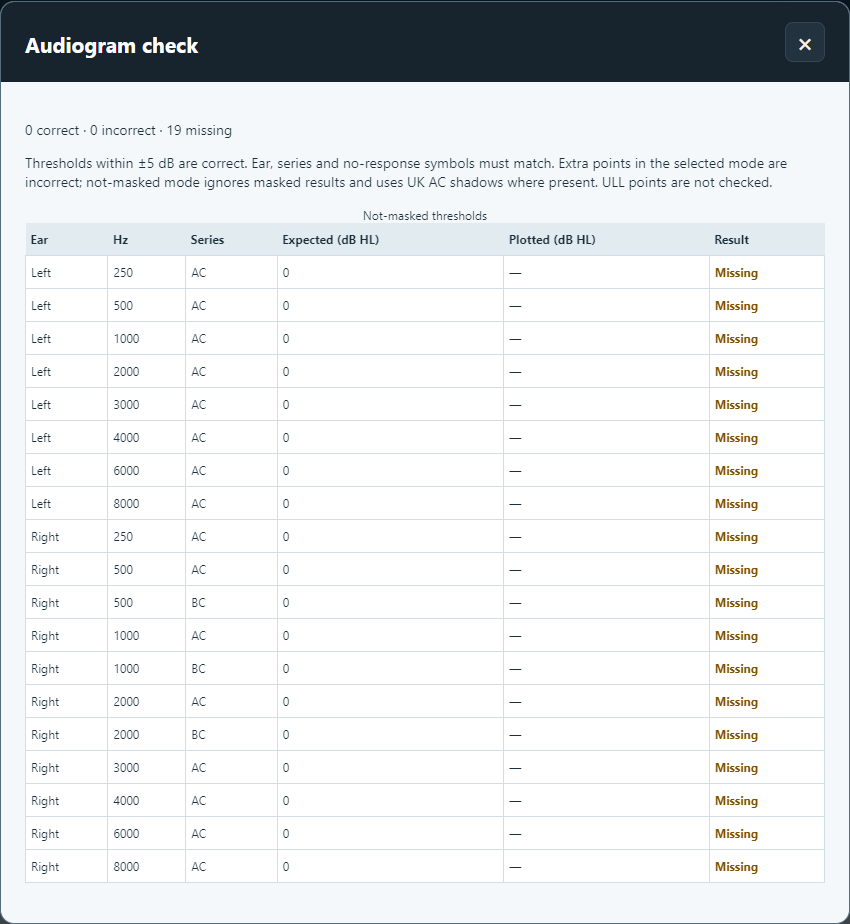
Compares your plot with the current patient’s ideal values for Not-masked thresholds or Mask where required, with not-masked shadows. Lists Correct, Incorrect and Missing by ear, frequency and series.
Levels within ±5 dB pass. Ear, series and normal/no-response symbols must match; extra relevant AC/BC points are incorrect. ULL is excluded. Ideal values omit response variability and direction effects.
Check method
Reviews session presentations: familiarisation, search steps, ascending confirmation, order/retest, masking rechecks and plateaux, tone duration and ISI.
Pass, Review, Incomplete and Info distinguish observed evidence from gaps. Feedback references presentation numbers. A correct plot cannot prove a correct method; rhythm feedback uses experimental teaching heuristics.
The audiogram check identifies missing and incorrect results without editing the plot. Select image to enlarge.Reveal the ideal plot after your attempt
Plot patient thresholds replaces existing AC/BC results with ideal values for the selected mode, retaining ULL. It is an answer/review tool, not a measurement. It also works with manually edited Patient settings. Save your own plot first.
AC is plotted at all eight testing frequencies; BC at 500, 1000 and 2000 Hz. Initial not-masked BC stays on the side with the worse mean initial AC at those three frequencies (right on a tie). Masked mode adds required results under Rules 1–3 only where an achievable plateau exists and retains not-masked shadows. Ideal levels round up to the next 5 dB; values above 120 use NR at 120. Actual measurement output limits still apply during testing.
Practice exercises with a purpose
General audiometry: choose a young, typical-for-age baseline, no additional losses and no conductive component. Practise the frequency sequence, 1000 Hz retest and ascending confirmation; review timing and search steps.
Cross-hearing: add a large flat sensorineural component to one ear. Measure not-masked, then inspect Visual helper to explain why the worse ear can appear better than its own cochlea.
Conductive loss and BC: add a unilateral conductive component. Compare AC and not-masked BC, use Masking helper to identify outstanding requirements, then document a BC masking series.
Cross-masking: create bilateral conductive components. Inspect how masker transmission limits the plateau; compare the chart, Visual helper and method feedback.
More complex patterns: explore high/low-frequency loss, cookie bite, NIHL and BC notches. Inspect the actual generated patient values.
Not every generated case requires every rule or permits a plateau. Inspect the resulting case rather than assuming a preset guarantees a particular masking exercise.
Keep method feedback interpretable
Review one patient per attempt. Editing the patient midway creates mixed-patient evidence. The log records a patient revision identifier without revealing thresholds. Results present before the first tone are treated as supplied information; their original measurement method was not observed. Later plotted but unlogged points also cannot prove a procedure. Resetting the log removes the evidence available to Check method.
Plots, overlays and annotations
Plot settings opens editable data and display options. Enter supplied thresholds, edit points or add ULL data. Select UK or NZ symbols for your exercise; masked/not-masked AC routing and symbol conventions differ.
To replace a point, select the same ear, frequency and category and store the corrected level, or edit its value in Plot settings. Selecting the blank/dash entry in the plot-data table deletes that entry. ULL means uncomfortable loudness level: it can be entered as plot data, but patient loudness comfort is not simulated.
When AC is remeasured with masking, the original not-masked value can remain as a shadow. Coincident values use a combined symbol in UK mode; NZ displays the masked symbol while retaining the underlying values. BC has separate not-masked and masked series.
Annotate either audiogram
Open Annotation, choose freehand, line, arrow or text, and draw over either ear. Enter text before placing it; keyboard users can choose Add text at centre for the selected ear. Choose colour, undo the last annotation or clear annotations independently of masking-chart notes.
View mode or hiding the panel stops drawing while finished annotations remain visible. Notes follow the plot through redraws, resizing and layout changes. Both audiogram PNG controls include completed notes and omit the live crosshair. Notes are not saved in links.
PTA notes are separate from masking-chart annotations. Select image to enlarge.Age and noise reference overlays
In Plot settings, toggle the ISO 7029 age-related overlay and set age, male/female reference and interval. For ISO 1999 noise/age, set LEQ8h and years of exposure and choose age display options. Shaded regions describe model reference ranges, not measured responses.
Age reference: enable Presbyacusis ISO7029, enter age, select the male/female reference and choose the displayed interval (75%, 80% or 95%). Select a colour to distinguish the shaded range.
Noise and age: enable NIHL+AGE ISO1999 and enter LEQ8h, the noise exposure level referenced to an eight-hour working day, plus years of exposure. The age and male/female settings above also apply.
Compare age with age plus noise: select Also plot age alone to show the age-only shading alongside the combined prediction. This helps illustrate the additional modelled effect of noise exposure.
Keep the comparison: export the audiogram PNG, or use Save image (new window) and your browser’s save/copy image commands to place it in a report or teaching document.
For an example, compare a 50-year-old male reference with 25 years of exposure at LEQ8h 90 dB, then switch the age-only comparison on and off. The shaded ranges are reference predictions, not an individual diagnosis or proof of the cause of a measured loss.
Overlays change the display, not the patient’s cochlear thresholds. Tutorial age/NIHL generation is a separate action. The full-page layout includes the symbol legend; toggle back for the compact display.
Review the presentation log
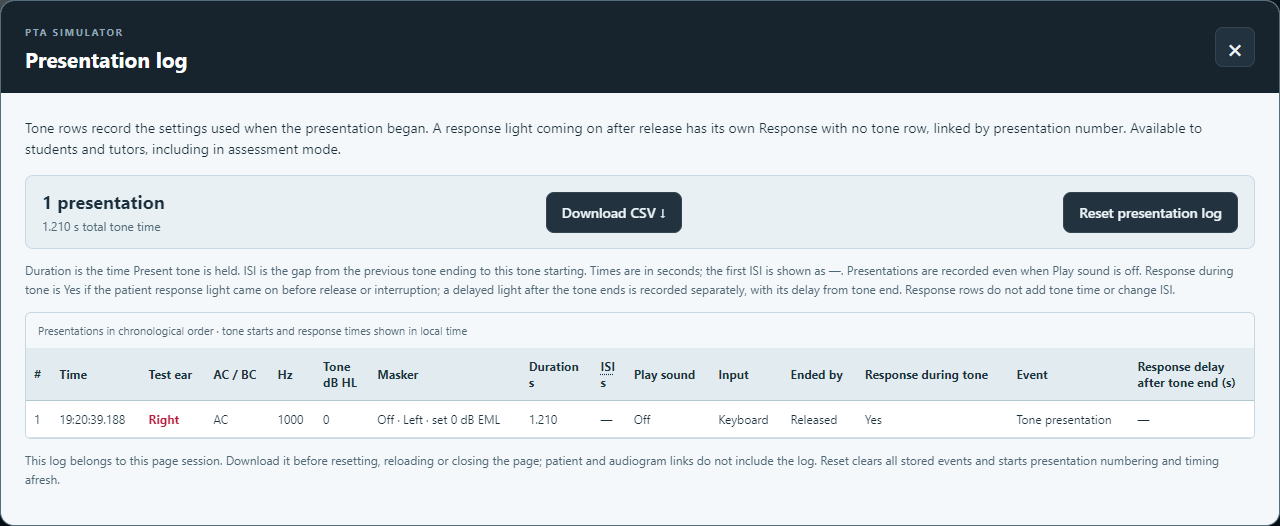
A recorded tone with its settings and control timings. Select image to enlarge.
Open Presentation log for a chronological record of tones, including in assessment mode. A tone row is added when a presentation ends, with settings captured at onset: ear, AC/BC, frequency, tone and masking levels, sound setting and input method. Settings changes and storing points alone do not create rows.
Duration is how long Present tone was held. ISI is the preceding tone’s end to this tone’s start; the first ISI is blank. Both use a monotonic clock and display seconds to three decimal places. They measure simulator control timing, not physical audio output.
Response during tone reports whether the actual response light came on during that presentation. A light appearing only after release creates a separate Response with no tone row linked to its original presentation. That row adds no tone time and does not change ISI. Interrupted tones retain their end reason.
For tutor review, submit the CSV alongside the audiogram and masking-chart PNGs. The plot shows the result; the journal helps explain how it was obtained.
Tympanometry and acoustic reflex testing
The Immittance simulator uses the patient prepared in PTA Patient settings. Set a tympanogram type or reflex setting for at least one ear, then open Tymp/ART ↗ at the top of the PTA screen, or Tymp/ART link inside Patient settings. The simulator opens in a new tab. Opening the plain immittance simulator starts without a patient; use the generated link to load your case.
Place the probes before testing
In Patient setup, choose an ear for the Ipsi probe, then select Insert. The Ipsi probe measures compliance and supplies the stimulus for ipsilateral ART testing. For contralateral testing, choose the opposite ear for the Contra probe and insert it too. Only one probe can occupy an ear. The diagram faces the patient: their right is on your left.
Changing a placement selector alone does not move a probe. Select Remove before refitting. The RIGHT / LEFT and IPSI / CONTRA test buttons select the result set; they do not move fitted probes. Actual probe placement determines the measured ear and stimulus pathway. Check both before starting. Fitting changes and switching mode, selected ear or route release pressure; press START again.
Measure a tympanogram
Prepare the patient. In PTA Patient settings, choose a tympanogram type and enter ECV, Comp and MEP for the ear where the Ipsi probe will sit. These fields must be set before measurement; see the patient settings below.
Select TYMP and the ear. Insert the Ipsi probe in the intended ear and use the RIGHT / LEFT button to select that ear's result set. The Contra probe is not needed for tympanometry.
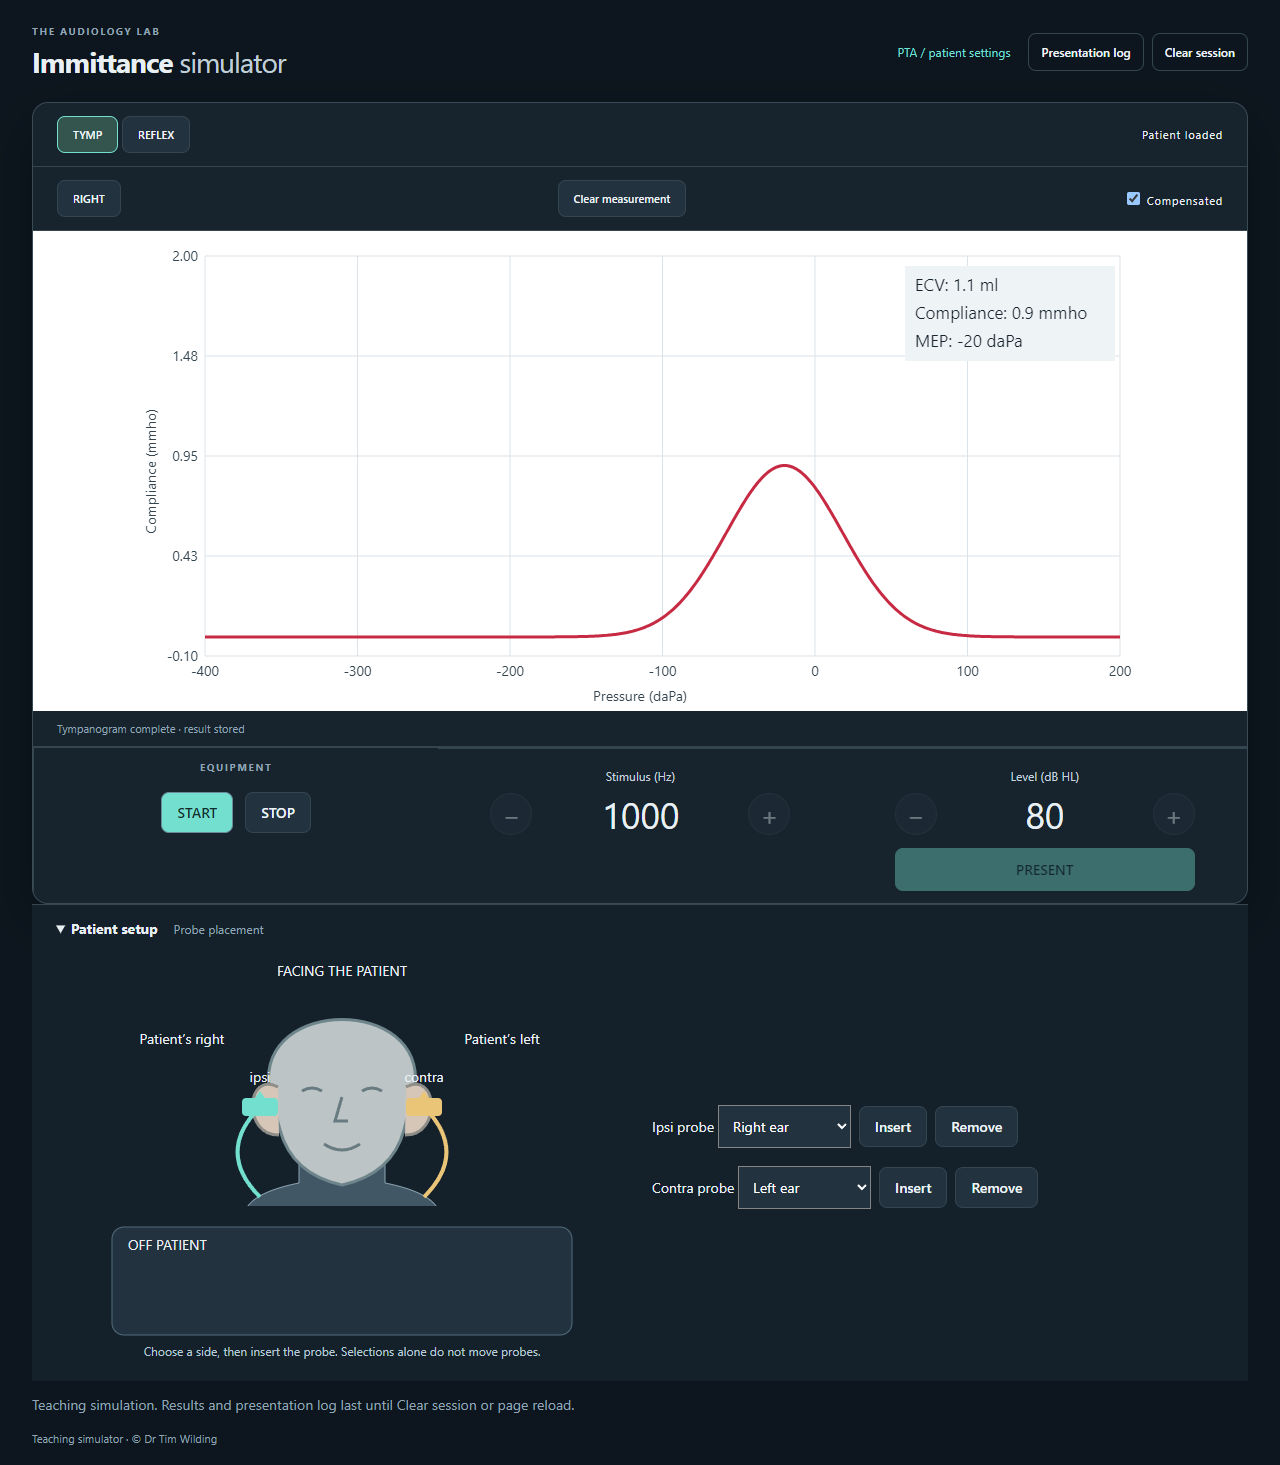
Press START. The pressure sweep runs from right to left across the plot. Wait for the completed ECV, compliance and MEP readout. Frequency, level and PRESENT controls are inactive in TYMP mode.
Compare the display. With Compensated checked, the canal-volume contribution is subtracted. Uncheck it to include ECV in the plotted compliance. NP in Comp or MEP produces a flat trace in this simulator.
Test the other ear. Remove and insert the Ipsi probe on the other side, select that ear and press START. Each selected ear retains its latest tympanogram; another START replaces that ear's display while the journal keeps earlier measurements.
A completed compensated tympanogram and the separate probe-placement controls. Select image to enlarge.
STOP interrupts the sweep and releases pressure. An interrupted run remains in the journal. Completed results survive switching to REFLEX mode.
Measure acoustic reflexes (ART)
Prepare the ART settings. Set Reflex setting, the relevant Ipsi/Contra thresholds and Middle ear status in PTA Patient settings. Normal middle ear permits a response; Abnormal Middle ear on the measurement-probe side produces no measured reflex in this model. The stimulus ear's PTA conductive component reduces the effective stimulus level.
Select REFLEX, ear and route. Fit Ipsi in the measurement ear. IPSI uses that same probe for the stimulus; CONTRA uses the separately fitted Contra probe. A missing Ipsi probe blocks START; a missing Contra probe gives a flat underlying response during CONTRA testing.
Select stimulus and level. Use the − / + buttons for 500, 1000 or 2000 Hz and levels from 0 to 115 dB HL in 5 dB steps.
Press START and observe the baseline. A clean fit briefly wobbles, then settles to zero. The vertical line in the horizontal bar shows live change in compliance on a fixed −0.10 to +0.10 mmho scale. With a noisy fit it continues moving; PRESENT becomes available after the brief initial preparation even if the baseline remains unstable.
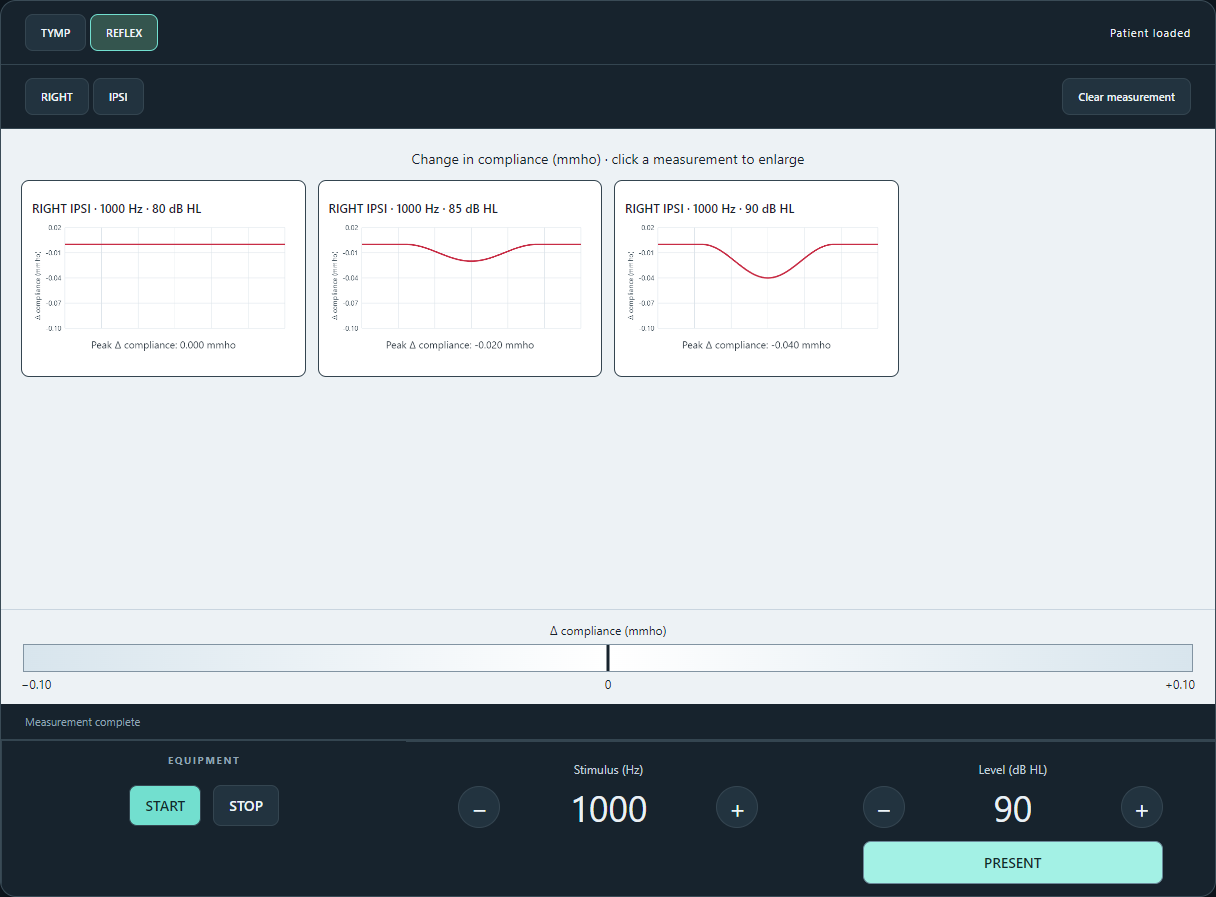
Click PRESENT once for each measurement. One click records one trace at the selected level. The bar follows the same instantaneous signal as the plot. A clean reflex produces a negative dip and returns to zero. At the simulated threshold its peak change is −0.020 mmho; larger responses or artefacts may exceed the visible scale. Adjust the level and repeat as instructed by your tutor.
Review the stored set. Results are separate for each selected ear, IPSI/CONTRA route and frequency. Changing these selections displays that set's earlier traces rather than deleting them. Click a tile to enlarge; click again or press Escape to return.
Three clean ART recordings in the same ear/route/frequency set. Select image to enlarge.
The plot area keeps a fixed height. Tiles shrink in steps as the set fills; they remain clickable to enlarge. At the minimum size, Results full blocks another measurement. Download the journal if needed, then use Clear measurement to make room in that set.
STOP releases pressure and stops the live bar, including noise between recordings. Probe fitting changes, switching mode/ear/route, clearing results and losing window focus also stop monitoring. Press START to resume; it does not change the existing fit state.
Recognise and resolve noisy ART recordings
When probe-fit problems are enabled for the patient, insertion can produce one of three simulated conditions:
Fit condition
What you observe
Good
The bar settles near zero after START and recordings have a clean baseline.
Unstable
The bar continues wandering and traces include drift and irregular fluctuations that can obscure a reflex.
Poor
Larger fluctuations and movement artefacts prevent a stable baseline and make recordings difficult to interpret.
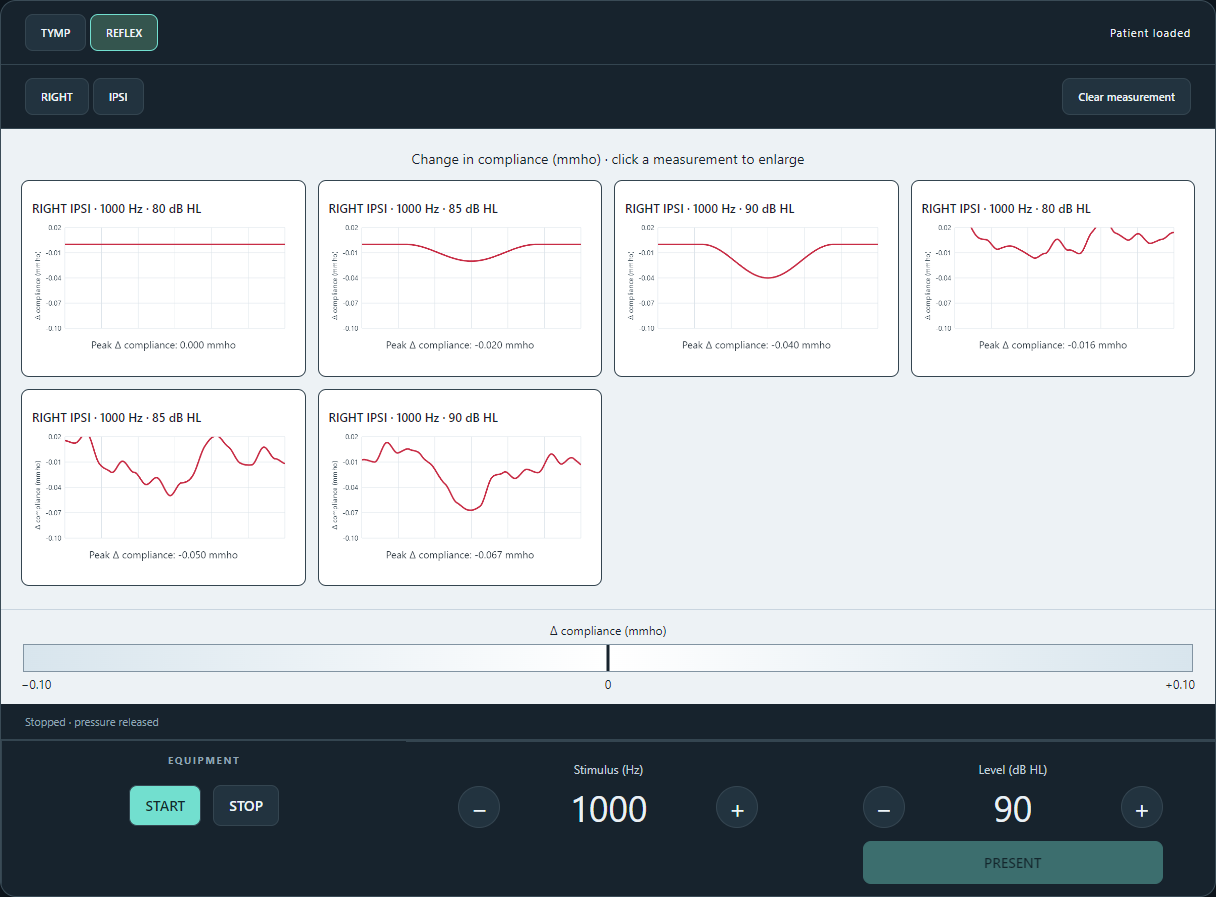
These state names explain the model; the testing screen does not announce which fit was drawn. Noise continues between measurements and is added to the reflex signal, so an irregular dip may be an artefact or a reflex obscured by noise. The peak readout describes the recorded signal, including noise.
Clean recordings followed by recordings after a noisy refit. STOP has returned the bar to zero; the stored noisy traces remain. Select image to enlarge.
To try to resolve noise: remove the Ipsi probe, reselect its intended ear if needed, insert it again and press START. Each insertion draws a new fit using that actual ear's settings. STOP/START, clearing results and repeated Insert clicks while already fitted do not draw a new state. Refitting may still produce a problem; at 100% probability it always will. Contra probe fit does not generate noise in this simulator.
Noise in a saved tile stays the same when you enlarge it or revisit the set. Noisy ART results show Unclear in the journal and CSV, rather than revealing the underlying reflex response.
Tutors can set the probability and severity in PTA Patient settings. Both ears default to 0%, preserving clean recordings for existing cases.
Clear results and keep the immittance journal
Control
What it clears
Clear measurement in REFLEX
Only the displayed selected ear, IPSI/CONTRA and frequency set. Other ART sets, tympanograms and the journal remain.
Clear measurement in TYMP
Only the selected ear's tympanogram. Other results and the journal remain.
Clear session
All tympanograms, ART sets and journal rows. It stops monitoring but does not remove fitted probes or redraw their fit states.
Presentation log in the immittance simulator records both TYMP and ART runs. It includes selected ear and the actual Ipsi/Contra probe placements at onset. ART rows also include frequency, level, route, stimulus ear, probe ear and response; TYMP rows include ECV, compliance and MEP. Interrupted runs are retained. This journal is separate from the PTA tone journal and does not record tone duration or ISI.
Select Download CSV before Clear session, reload or closing the tab. Patient links retain the patient settings, including noise probability and severity; they do not retain measured tympanograms, ART traces, probe placements, fit states or this journal.
03 / Build a patient with a teaching purpose
Tutors and students practising independently can use Tutorial for a generated case or Patient settings for precise values at each frequency. Patient parameters define the simulated hearing system; plot data defines the recorded audiogram. Editing one does not automatically edit the other.
What each Tutorial setting changes
Age and ISO 7029 reference: a shared left/right baseline at 18–80 years. Better/typical/poorer for age means the 25th/50th/75th percentile. Random selects within the IQR (middle 50%). These are age-relative positions, not absolute loss severity labels.
Additional sensorineural loss: choose one/both ears and a flat, high-frequency, low-frequency or cookie-bite shape. Cookie bite peaks at 2 kHz, adding no loss at 250 Hz or 8 kHz; the age baseline remains at the endpoints.
NIHL (ISO 1999): optionally combines median noise loss with the age baseline in both ears using age + noise − age × noise / 120. Set LEQ8h and exposure years. Noise covers 500–6000 Hz; shaped SNHL is added afterwards.
Conductive components: independent left/right minimum and maximum (0–60 dB). Equal shapes keep both equal; slopes span the limits. 2/3 kHz notched conductive shapes have their minimum at that frequency and maximum at 250 Hz and 8 kHz.
BC notch: separately choose None, 2 kHz or 3 kHz and peak attenuation (0–30 dB) for each cochlea. The broad profile applies only at frequencies with a non-zero conductive component. None or zero peak clears generated BC attenuation.
Headphone IA: select 40–80 dB or random. Generation clamps the chosen value to each frequency’s limits. View IA ranges by frequency shows the limits; inspect the actual generated values in Patient settings.
BC occlusion effect: defaults to zero at all frequencies. Choose the 25th, 50th, 75th or 90th percentile, or Random, to generate a shared left/right frequency profile from the TDH-39 means and standard deviations reported by Wallaert et al. (2024). Percentiles are normal-distribution estimates; negative values are set to zero. Random uses one randomly sampled percentile across frequencies. No 8000 Hz data are available, so that setting remains zero. View TDH-39 occlusion by frequency shows the source table.
These frequency shapes are teaching presets. Generation overwrites earlier manual cochlear, conductive, BC attenuation, BC occlusion and IA values. Links save the generated patient, not the builder selections. Response variation settings remain as they were.
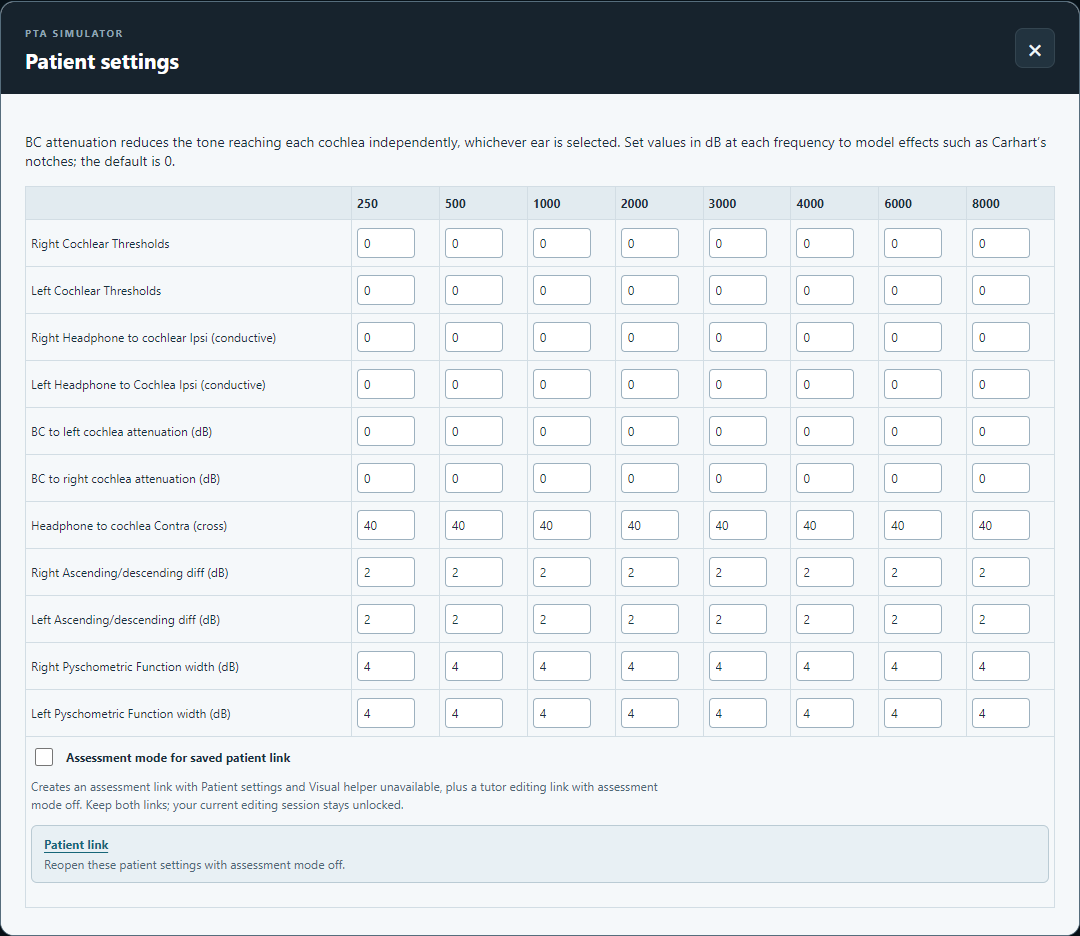
BC transmission is entered independently for each cochlea. Select image to enlarge.
Setting
Meaning in this simulator
Right / Left Cochlear Thresholds
The cochlea’s baseline threshold in dB: the sensorineural component, not automatically measured AC or BC.
Headphone to cochlea Ipsi (conductive)
AC attenuation to the same-side cochlea. Ideal ear-specific AC = cochlear threshold + conductive component. With BC attenuation present, this component is no longer simply the measured air–bone gap.
BC to left / right cochlea attenuation
Enter the attenuation you want in dB: for 10 dB attenuation, enter 10, not −10. The simulator subtracts this value from the BC tone reaching that cochlea, whichever test side is selected. Ideal ear-specific BC = cochlear threshold + BC attenuation. Default: 0 dB.
BC occlusion effect
A shared left/right value at each frequency, defaulting to 0 dB. During fitted BC stimulation, this adds to the level reaching each cochlea whose ear is covered by an AC earphone, as determined by Patient setup. Each side’s BC-to-cochlea attenuation still subtracts independently. An earphone above the ear does not cause occlusion, and off-head BC does not use this effect. Occlusion applies to the initial covered-ear recheck with the masker off and to subsequent masking; method review and masking-chart references/checks include it. Audiogram reference plotting and checking remain unchanged.
Headphone to cochlea Contra (cross)
AC interaural attenuation: dB subtracted from a tone or masker crossing to the opposite cochlea. It is separate from the conductive component; check every frequency.
Ascending/descending difference
Direction-dependent shifts around the apparent threshold. The response calculation applies half the entered difference with opposite signs for its ascending/descending decisions.
Psychometric Function width
The region of response uncertainty in dB around threshold. Wider values allow greater variability. Zero width and zero direction difference give a deterministic teaching case.
Without masking, either cochlea may produce the response. Ideal not-masked AC is the lower of same-side cochlear threshold + conductive component and opposite-side cochlear threshold + AC IA. Ideal not-masked BC is the lower of the two cochlear threshold + BC attenuation values. Masking and response variation affect observed responses.
Patient settings for immittance test simulation
The Tympanometry and acoustic reflex thresholds section contains separate settings for each ear for immittance test simulation. These settings do not change PTA responses or calculations. When a tympanogram type or reflex setting is set for either ear, a Tymp/ART link appears beneath the existing links in Patient settings. It opens the immittance simulator in a new tab with the same patient settings; the adjacent Copy link button copies its address.
Patient setting
Values and purpose
Tympanogram type
Not set (default), Type A, Type B or Type C, independently for each ear. Not set disables that ear’s MEP, ECV and compliance fields.
MEP (daPa)
Middle ear pressure, entered as a whole number from −999 to 999, or NP for no peak. Starts blank.
ECV (ml)
Ear canal volume, entered to one decimal place. Starts blank.
Comp (mmho)
Compliance, entered to one decimal place, or NP for no peak. Starts blank. The current Type C setting automatically sets MEP and Comp to NP and disables those two fields; changing to Type A or B restores numeric entry.
Reflex setting
Not set (default), Cochlear (normal) or Retrocochlear. Not set disables the reflex threshold entry boxes and Auto set button for that ear; entered values are retained.
Ipsi / Contra thresholds
Separate acoustic reflex thresholds at 500, 1000 and 2000 Hz for each ear and route. Each starts blank. Enter a whole number from 0–200 dB HL; enter 200 for NR (no response).
Auto set reflex thresholds
Replaces that ear’s six reflex thresholds using its cochlear thresholds at 500, 1000 and 2000 Hz and its Reflex setting. Cochlear (normal) generates values within the supplied normative range, ending 5 dB below a numeric upper cut-off to allow for good-fit noise. Tutors can still enter the exact cut-off manually. Retrocochlear generates values at least 5 dB above a numeric cut-off, or 200 (NR). The other ear is unchanged. Enter numeric cochlear thresholds at all three frequencies first.
Middle ear status
Not set (default), Normal middle ear or Abnormal Middle ear, separately for each ear. Abnormal status on the Ipsi measurement-probe side prevents a measured ART response in this simulator.
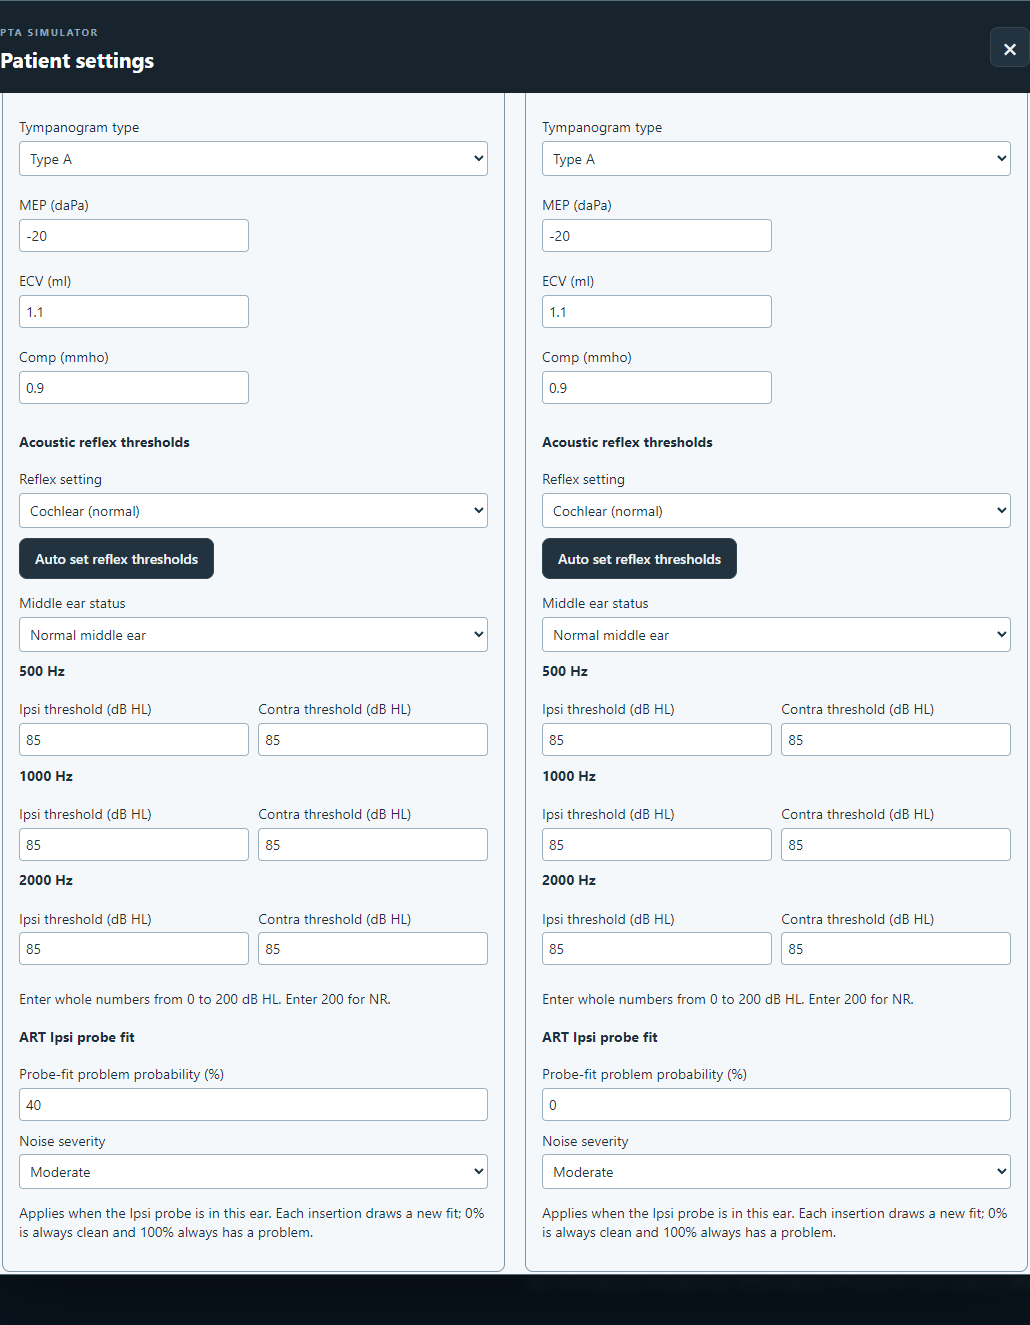
ART Ipsi probe fit: problem probability (%)
Separate per-ear odds from 0 to 100%, default 0%. Applied each time the Ipsi probe is inserted in that actual ear. 0% always gives a clean fit; 100% always gives an Unstable or Poor fit.
ART Ipsi probe fit: noise severity
Mild, Moderate (default) or Severe. Controls the magnitude of drift, fluctuations and movement artefacts for a problem fit. It has no effect with 0% probability and does not change underlying reflex thresholds, PTA or tympanometry.
Auto set uses the supplied Gelfand et al. (1990) contra 10th–90th percentile ranges. Applying these ranges to ipsi thresholds is a teaching approximation. Cochlear thresholds are rounded to the nearest 5 dB table row; values below 0 use the 0 dB row and values of 90 dB or higher use the ≥90 row. Where the normative upper limit is NR, cochlear auto-setting retains numeric choices through 125 dB HL plus 200 (NR); the feedback explains that ART cannot distinguish cochlear and retrocochlear patterns at that frequency.
Immittance patient settings in PTA. This example allows problem fits on right-ear Ipsi insertion while keeping left-ear fits clean. Select image to enlarge.
Prepare a noise exercise: under ART Ipsi probe fit, set the desired ear's problem probability and choose severity. For example, 40% with Moderate severity gives a problem on roughly four in ten insertions over many attempts; a single refit may be clean or noisy. For a guaranteed noisy exercise choose 100%; set 0% for clean practice. A problem draw chooses Unstable or Poor with equal probability.
Open the updated Tymp/ART link after editing patient settings. To apply those odds, remove and reinsert the Ipsi probe in the intended ear, then press START. The fit is drawn at insertion, so repeated START does not reroll it. Follow the measurement instructions to observe the baseline, record traces and try refitting.
These values are included in saved patient links. Older links leave the original immittance fields Not set or blank and default both probe-fit probabilities to 0% with Moderate severity. Values already entered are retained when their fields are disabled.
Worked example: AC loss and BC transmission are different
At 1000 Hz, right cochlear threshold 20 dB and right conductive component 20 dB give ideal right AC 40 dB. With right BC attenuation 0, ideal ear-specific BC is 20; with BC attenuation +10, BC becomes 30 while AC remains 40.
Those are ear-specific values. If the left cochlea has lower effective BC threshold, not-masked BC may reveal it instead. Mask to establish which cochlea is responsible.
BC attenuation: Carhart’s-notch and SSCD-style teaching patterns
Carhart’s-notch-style pattern: enter positive BC attenuation centred at 2 kHz to worsen BC transmission without increasing the cochlear threshold. Tutorial BC notch/peak controls generate a broad profile where conductive loss is present. Use Patient settings for an exact frequency pattern.
SSCD-style teaching pattern: set the cochlear thresholds to the intended sensitive BC baseline and use the AC conductive component to create the desired AC/BC separation. Leave BC attenuation at 0 where no BC transmission loss is intended. Do not enter a negative value in the attenuation box to represent an amount of attenuation.
These illustrate audiometric patterns, rather than modelling the full pathology. Check cross-hearing and masking before treating not-masked BC as ear-specific. Testing and plotting limits still apply, including the −10 dB plot floor.
Validate before distributing a case
Inspect all parameters, especially IA, BC attenuation and response variation.
Use Plot patient thresholds and Check current audiogram to inspect the ideal pattern and whether masking is measurable.
Try the intended testing and masking sequence. Ideal plots exclude variability and direction effects.
Clear answer plots you do not intend to supply. Existing plot data is included in patient links; supplied points are treated as prior information by method review.
Create the appropriate links and test them in a fresh tab. Keep your tutor editing link for revisions.
Practice and assessment mode
Students: assessment links hide patient parameters and teaching feedback, but you can still measure, plot and document an attempt. For practice with feedback, use an unrestricted patient link or create a fresh case in the plain simulator.
Feature
Practice
Assessment link
Tone controls, AC/BC, masking and response light
Available
Available
Plot settings, Store, delete and PNG/link export
Available
Available
PTA annotations and Masking chart
Available
Available
Presentation log and CSV
Available
Available
Patient settings
Available
Disabled
Visual helper and Masking helper
Available
Disabled
Tutorial generation, ideal plotting, audiogram and method checks
Available
Disabled
Tutors: at the bottom of Patient settings enable Assessment mode for saved patient link. This generates an Assessment link for students and a separate unrestricted Tutor editing link. Your current editing session stays unlocked. Keep the tutor link private if students should work without teaching aids.
After editing a case, enable assessment mode again and copy the updated pair. With it off, one unrestricted Patient link is shown. Opening the plain simulator starts a separate default case; it does not recover your assessment patient for editing.
Save links, images and session evidence
Keep this
Purpose
Remember
Patient / Assessment / Tutor editing link
Reopen encoded patient and plot settings.
Copy after final edits; keep the tutor link for restricted cases.
Audiogram Save link
Reopen encoded plot data/settings.
Keep the patient link too when you need the same simulated patient.
Audiogram PNG
Share a static result with PTA annotations.
Export before leaving; the crosshair is omitted.
Masking chart PNG
Share the selected curve and annotations.
Export each required curve.
Tymp/ART link
Reopen the same immittance patient, including per-ear noise settings.
Measurements, placements and fit states are session-only.
Immittance journal CSV
Keep TYMP and ART measurement evidence and actual probe placements.
Download from the immittance Presentation log before clearing or leaving.
Presentation log CSV
Review/submit procedure and timing evidence.
Download before reset, reload or closing.
Right-click a generated link and choose Copy link address/location, then paste it into saved notes or a teaching document. Links update as values change; earlier copies retain earlier encoded values. Both older Base64 loadp and current compressed loadl links are accepted.
There is no account or automatic database save. Presentation logs, immittance measurements, masking worksheets, masking curves and all annotations are session-only and are not included in saved links. Export them before leaving. Copying the browser address bar after edits is not a substitute for copying the updated generated link.
Scope and support
This client-side teaching tool by Dr Tim Wilding helps audiology students practise PTA, particularly asymmetric losses and masking, and also provides an audiogram plotter. It approximates threshold responses with cross-hearing, conductive pathways, response variability and ascending/descending differences.
It is not a full psychoacoustic auditory model. It does not model central masking or binaural listening advantage, and cannot simulate Stenger, PTC or ABLB testing. Optional sound is illustrative, not calibrated audiometric output; selecting a dB level does not set a calibrated physical sound level.
If controls or plots fail to appear, try a current browser with JavaScript enabled. Report the browser, device and steps causing the problem to Dr Tim Wilding. Use the current screenshots in this guide to identify the controls.