Programming with Python (lab classes)
Stefan Güttel, guettel.com
Content:
- Histograms of the historical data
In the problems below we define a location as a (latitude, longitude) tuple, and a season as one of the codes associated with the temperate seasons, as defined by the readme file of the data used in the lectures:
"13": Winter,"14": Spring,"15": Summer,"16": Autumn.
A histogram is a graphical representation of the distribution of data. In essence, it is a plot that has ranges of values (often called bins) on the x-axis and the numbers of values that fall into those bins on the y-axis.
For example, Summers (code "15") around the Alan Turing Building (53.468001, -2.231462) have the following histogram values, given the bin size 0.25:
12.365: 1
12.615: 1
12.865: 5
13.115: 6
13.365: 11
13.615: 23
13.865: 40
14.115: 51
14.365: 55
14.615: 67
14.865: 62
15.115: 61
15.365: 45
15.615: 25
15.865: 13
16.115: 15
16.365: 16
16.615: 1
16.865: 2
17.115: 3
The values on the left are the midpoint values of the bins. So, the above listing means that, between the years 1500 and 2002, the average Summer temperature was:
once between $12.365-0.25/2=12.24$ and $12.365+0.25/2=12.49$,
once between $12.615-0.25/2=12.490$ and $12.615+0.25/2=12.74$,
five times between $12.865-0.25/2=12.74$ and $12.865+0.25/2=12.99$, etc.
Problem 1. Write a function
hist(latitude, longitude, season=None, minv=None, maxv=None, bin_size=0.1)
that returns a tuple of two lists:
- the list of midpoints (the left column in the above example), and
- the list of counts of values in the corresponding bins of the size
bin_size(the right column in the above example),
for the area to which the (latitude, longitude) position belongs. The parameters minv and maxv define the overall range of the considered temperatures (i.e., the minimum and the maximum value on the x-axis if the histogram is plotted). If either is undefined, the function uses the minimum or the maximum value, respectively, for that location and a given season.
If season is None, the histogram values are computed for all the seasons.
For convenience, feel free to add this new function to the seasons module (from the lectures, downloadable here (22MB) along with the data files).
A suggestion: Write a function ll2idx(latitude, longitude) that returns the index of the column containing the temperatures for the area that contains the location (latitude, longitude). The function should raise a ValueError exception in case the coordinates fall outside of the map and the programs using it should catch it.
Problem 1a. Write a program that uses this function to display the histogram for a given location in the above numerical way:
mid_temperature_1: number_of_temperatures_in_the_range_1
mid_temperature_2: number_of_temperatures_in_the_range_2
...
mid_temperature_n: number_of_temperatures_in_the_range_n
Problem 1b. Write a program that uses this function to display the histogram "drawing" like this:
[12.240, 12.490): * (1)
[12.490, 12.740): * (1)
[12.740, 12.990): ***** (5)
[12.990, 13.240): ****** (6)
[13.240, 13.490): *********** (11)
[13.490, 13.740): *********************** (23)
[13.740, 13.990): **************************************** (40)
[13.990, 14.240): *************************************************** (51)
[14.240, 14.490): ******************************************************* (55)
[14.490, 14.740): ******************************************************************* (67)
[14.740, 14.990): ************************************************************** (62)
[14.990, 15.240): ************************************************************* (61)
[15.240, 15.490): ********************************************* (45)
[15.490, 15.740): ************************* (25)
[15.740, 15.990): ************* (13)
[15.990, 16.240): *************** (15)
[16.240, 16.490): **************** (16)
[16.490, 16.740): * (1)
[16.740, 16.990): ** (2)
[16.990, 17.240): *** (3)
Note: The problems below include plotting with Matplotlib. The easiest way to get these done is to find similar examples in Matplotlib gallery and then adapt them to your needs with the help of the specific function's documentation.
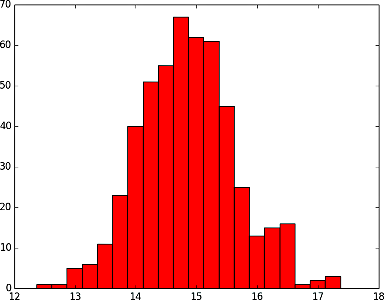
Problem 2. Write a program that uses the histogram data from the above and plots a bar-type histogram using matplotlib.pyplot.bar. For the above input, the plot should look like this:
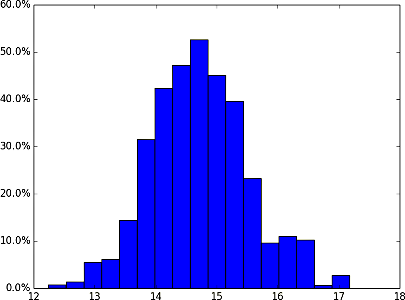
Problem 3. A normalized histogram is the one in which the values on the y-axis are the percentages in the overall sum of all values. For example, a histogram with the bin counts [2,3,7,5,3] would be plotted as ["10%", "15%", "35%", "25%", "15%"], because $2$ is $10\%$ of $2+3+7+5+3=20$, and $3$ is $15\%$, etc.
Write a program that uses matplotlib.pyplot.hist to plot a normalized histogram for a given location, season (can be ommitted, in order to use the data for all the seasons) and number of bins. The plot should be displayed on the screen and saved to the disk.
For example, the histogram for the Summers (code "15") around the [Alan Turing Building (53.468001, -2.231462)] and with 17 bins should look like this:
Problem 4. Write a program that uses matplotlib.pyplot.hist to plot (non-normalized) histograms for a given location and number of bins. The plot should be displayed on the screen and saved to the disk and it should contain each of the seasons (Winter in blue, Spring in green, Summer in red, and Autumn in orange) plotted as a separate steppfilled area, all in the same plot.
For example, the histogram for the area around the Alan Turing Building (53.468001, -2.231462) and with 17 bins should look like this:
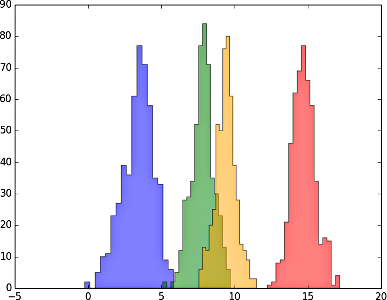
Hint: The semi-transparency effect below is achieved with the alpha=0.5 argument.