Calibration
Introduction to Calibration
In this topic you will study some of the basic theoretical and practical principles of calibration of audiological equipment. The basic principles of calibration will be explained and the scope and purpose of appropriate standards will be described. Following this, the calibration procedures for various types of audiological equipment will be explained along with accompanying practical sessions.
|
Learing Outcomes
|
|
On studying this material and the associated reading/suplementary material you should be able to demonstrate:
- An understanding of the basic principles of acoustics in relation to sound measurement
- An understanding of the different levels of calibration of audiological instruments
- The the basic skills and understanding to carry out clinic-based calibration of audiometers
|
Introduction
This section gives a basic overview of the calibration procedure, concentrating on pure-tone calibration with supra-aural headphones. Later sections will take you through different types of calibration procedures.
Why do we need calibration?
Calibration is a necessary part of using any audiological equipment, whether it is routine equipment such as Audiometers or specialist equipment used for research projects only.
- Need to know what you are getting/producing
- Need to know that equipment is doing what it is supposed to do
- Need to be able to verify that it is the same as other equipment
|
Figure 1 - Examples of Audiometers
|
|
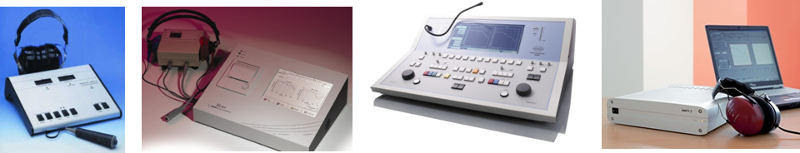
Figure 1 - Examples of different types of audiometers that need regular calibration to ensure that they are fit for the purpose of testing hearing. The type, complexity and features of each device will require different ranges of measurements, but the same principles will apply to calibrating each device.
|
By following the appropriate standards and calibration procedures we can be sure that audiometers throughout the country (or world) would produce the same thresholds in an individual subject. Or if we are carrying out a research project others would be able to exactly replicate what you have done.
What do you want to measure?
It is important that you know what you want to know!
Are you simply interested in the level of a pure-tone in dB SPL or:
- Do you need to convert to dB HL
- Do you need to measure the frequency of the signal
- Do you need to measure the duration and shape of the signal envelope?
- Do you need to measure the background noise, distortion, electrical interference etc.
What you want to measure determines the equipment you need and your approach to calibration.
What equipment do we need to carry out calibration?
Lets think of a basic examples first – calibrating a pure tone sound produced by a particular system:
How is the sound delivered (inserts, supra-aural, circumaural or free-field) this will determine how we couple the microphone to the sound production system
e.g. 2cc coupler, IEC711 coupler, 6cc coupler, Artificial ear, what *RETSPL values will we need.
*RETSPL = reference equivalent threshold sound pressure levels - see below.
Figure 2 gives examples of the sort of microphones/couplers you might need. If you are measuring free-field presentation then you will need a free-field microphone on your sound-level meter, if you are calibrating an audiometer with TDH39/49 supraural headphones then a 6cc ear simulator such as a B&K4152 with a 1" pressure microphone. If you want to calibrate other headphones you may need a B&K 4153 coupler that has a flat plate adaptor for super-aural headphones. Whichever coupler you use (and headphones) will determine what RETSPL you use to convert dB SPL to dB HL.
|
Figure 2 - examples of microphones and couplers
|
|
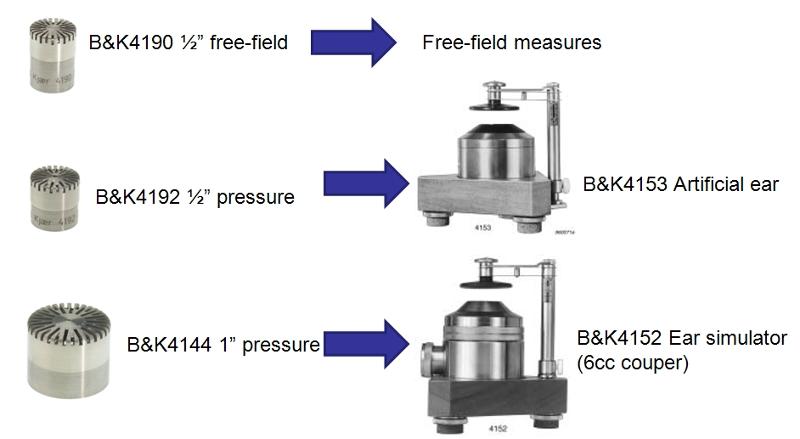
Figure 2 - examples of microphones and couplers that might be used to measure audiometer output for calibration purposes.
|
Depending on what it is you want to measure you will also need an appropriate measureing device:
- Do we just want to measure the dB SPL - if so probably just need a SLM connected to the appropriate microphone and coupler
- Do you want to measure the frequency also - if so you will also need to be able to connect the SLM output to a frequency counter.
- Do you want to measure the waveform envelope - if so you will need to be able to capture the waveform on an oscilloscope
- Do you want to measure the shape of the spectrum or 1/3-octave analysis of the signal - in oder to do this you will need a spectrum analyser
|
Figure 3 - examples of equipment for AC audiometer calibration
|
|
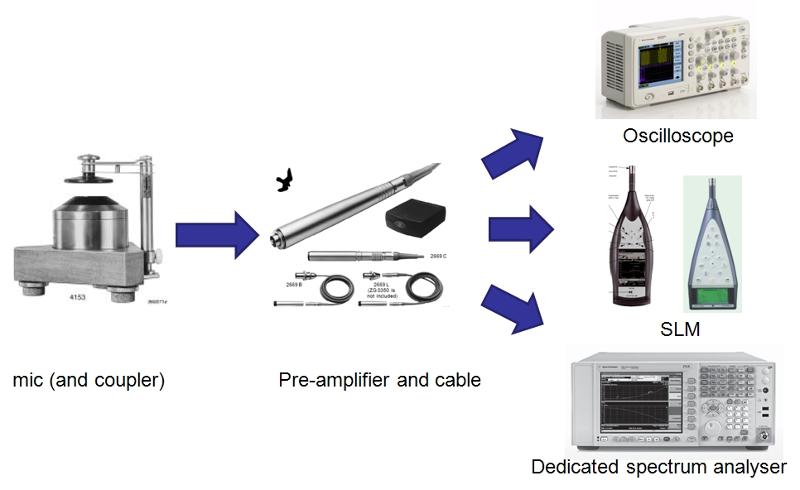
Figure 3 - the microphone and coupler transduce the acoustic signal from the audiometer (via supra-aural headphones in this example). These are then connected via a pre-amplifier and cable to a device for displaying and measuring the electrical signal. This may be an oscilloscope to show the waveform and make calculations from that, or a sound-level meter or spectrum analyser to give dB SPL values or show the signal spectrum.
|
Calibrating the measurement system
Once you have connected the measurement equipment together you will need make sure that it is giving the correct reading i.e. if you put a known signal into it does it give the correct reading?
This is usually done by playing a known signal into the measurement system using a sound level calibrator (94 dB SPL at 1 kHz) or a pistonphone (124 dB SPL at 250 Hz) and then adjusting the sensitivity of the measuring device so that the display gives the correct reading.
(Use an appropriate calibrator if available – e.g. if you are using a 250Hz calibrator but your system will be used at 16kHz the measurements probably won't be correct!)
Below are pictures of a sound level calibrator, a pistonphone and a multi-frequency calibrator.
|
Figure 4 - Sound level calibrators
|
|
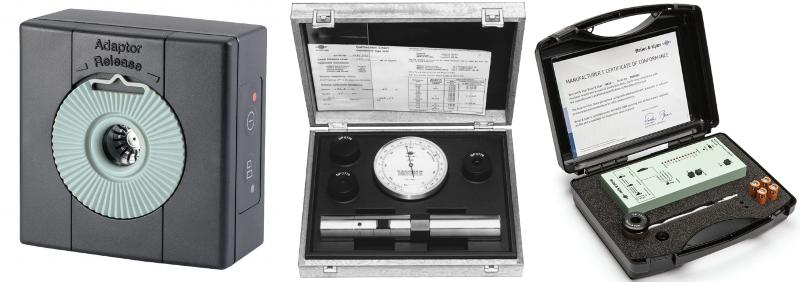
Figure 4 - 3 different examples of reference sound sources that can provide a known sound level at specific frequencies to allow our measurement system to be calibrated. From left right we have:
- Sound level calibrator - produces 94 dB SPL at 1kHz set up for calibrating a 1/2 inch microphone (the green insert can be removed to calibrate a 1-inch microphone.
- Pistonphone - produces 124 dB SPL at 250Hz for either a 1/2" or 1" microphone.
- Multifunction Acoustic Calibrator which allows a range of different sound frequencies and levels to be used for calibration.
|
So, for example, if you have a 1/2" microphone attached to a sound level meter and play out a 94 dB SPL tone at 1kHz, the sound level meter should read 94 dB SPL if it is correctly adjusted. If this is the case then you can now use this system to measure the output of the audiometer (or other device) that is to be calibrated. However, we first of all need to think about what signal level we should be getting - for example if our audiometer is set to 0 dB HL on the dial, what dB SPL does this correspond to - after all, our measurements are in dB SPL, not dB HL.
RETSPL - Reference Equivalent Sound Pressure Levels
So we now need to think about is what levels do we expect? If we are calibrating for puretone air conduction audiometry with TDH39 headphones an a B&K4152 6cc coupler we need to know what dB SPL measured on the coupler should correspond to 0 dB HL (as it is HL we set on the auriometer dial). To find this out we need to look at the appropriate standards to get this RETSPL value. In this example it would be part 1 of BS EN ISO 389.
The RETSPL value is the dB SPL that corresponds to 0dB HL for a given headphone/coupler combination. This set of values is obtained from the measured thresholds in otologically normal young adults. These reference values depend on the type of transducer, the type of coupler/artificial ear being used and the type of signal being used. The values are given in the various parts of BS EN ISO 389.
- BS EN ISO 389-1:2018 Acoustics. Reference zero for the calibration of audiometric equipment - Part 1: Reference equivalent threshold sound pressure levels for pure tones and supra-aural earphones
- BS EN ISO 389-2:1997 Acoustics. Reference zero for the calibration of audiometric equipment - Part 2: Reference equivalent threshold sound pressure levels for pure tones and insert earphones
- BS EN ISO 389-3:2016 Acoustics. Reference zero for the calibration of audiometric equipment - Part 3: Reference equivalent threshold force levels for pure tones and bone vibrators
- BS EN ISO 389-4:1999 Acoustics. Reference zero for the calibration of audiometric equipment - Part 4: Reference levels for narrow-band masking noise
- BS EN ISO 389-5:2006 Acoustics. Reference zero for the calibration of audiometric equipment - Part 5: Reference equivalent threshold sound pressure levels for pure tones in the frequency range 8 kHz to 16 kHz
- BS EN ISO 389-6:2007 Acoustics. Reference zero for the calibration of audiometric equipment - Part 6: Reference threshold of hearing for test signals of short duration
- BS EN ISO 389-7:2019 Acoustics. Reference zero for the calibration of audiometric equipment - Part 7: Reference threshold of hearing under free-field and diffuse-field listening conditions
- BS EN ISO 389-8:2004 Acoustics. Reference zero for the calibration of audiometric equipment - Part 8: Reference equivalent threshold sound pressure levels for pure tones and circumaural earphones
- BS EN ISO 389-9:2009 Acoustics. Reference zero for the calibration of audiometric equipment. - Part 9: Preferred test conditions for the determination of reference hearing threshold levels
Calibrating
So now we have a calibration system assembled and calibrated, we know what dB SPL we should be getting if the audiometer is set to 0 dB HL and so we can start our measurements. First of all though we need to think about background noise - if we set the audiometer dial to 0 dB HL then it is unlikely that we will get a sensible reading from the sound level meter because the reading will be contaminated by background noise. To get round this we usually set the dial to 60 or 70 dB HL to get a good signal-noise ratio.
0dB HL + RETSPL = expected dB SPL corresponding to otologically normal threshold
70dB HL + RETSPL = expected dB SPL corresponding to 70 dB HL
So we know what we should be getting at a particular frequency, we now make the measurements of the dB SPL from the headphones and compare with what we would expect. If the difference is less than 3.7 dB (125Hz-4kHz; 6.2 dB up to 8 kHz BS EN 60646-1:2015) then we can accept the audiometer as being in calibration (at that pure-tone frequency and level, for for that transducer only) - we now need to repeat at all frequencies for left and right, both AC and BC, supra-aural and insert-earphones and masking as well!
In later sections we will look at some of these different aspects.
What can go wrong?
Asuming that the calibration of the measurement system was OK then there are a range of things to think about before assuming that the audiometer needs adjusting:
- No signal – equipment not set up correctly (e.g. wrong earpiece on coupler, wrong channel selected, broken cables or equipment …, not turned on!)
- Signal audible but reading way too low:
- Damaged headphones
- Headphones not positioned correctly
- Wrong filter settings on measurement system (e.g. A-weighting selected, or peak on spectrum analyser not selected)
- External noises influencing measurements
- Make sure that you listen at the same time as making the measurements – can you hear extraneous noises, even if they are outside the room?
- Are you making extraneous noise – do you have your hands on the table? Are you talking?
- Is your mobile phone interfering with the equipment (even if it isn't ringing!)?
Sound Level Meters
In this brief section we will look at the basics of sound level meters. We will stick primarily to the sort of SLMs used for calibration of audiological equipment and those you might use to check free-field sound levels for speech-testing etc. In the previous section we mentied about how to calibrate SLMs and we will revisit this later.
Types of Sound Level Meters
There are 4 basic categories of sound level meters which are defined on the basis of their features, but more importantly their accuracy. These are defined in BS EN 61672-1:2003 Electroacoustics - Sound level meters. Specifications (with other information in other parts of BS EN 61672).
Class 1 SLMs:
Tolerances of between 1 to 3 dB over the frequency range 12.5 Hz to 8 kHz (+/- 1.1 dB at 1 kHz)
- It is these SLMs that should be used for calibration purposes.
- They have removable microphones and preamplifiers to enable them to be attached to couplers.
- A larger range of functionality aften including 1/3 octave spectrum analysis to allow the frequency content of a signal to be assessed.
- Additional software can often be purchased for more compelx analysis (e.g. reverberation time measurement or data logging).
Below are two examples of Bruel and Kjaer Class 1 sound level meters
|
Figure 5 - examples of class 1 SLMs
|
|
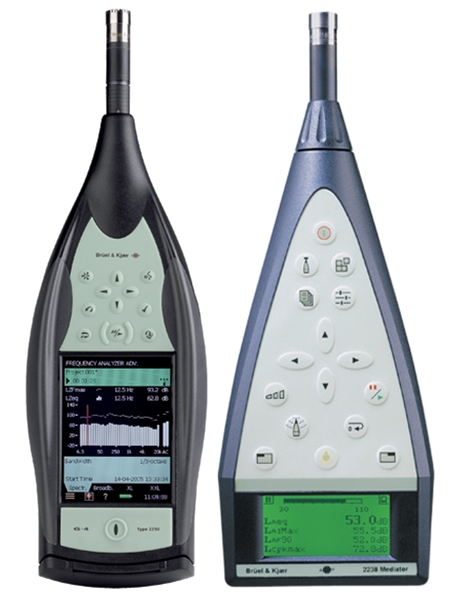
Figure 5 - examples of two class 1 sound level meters (the two that we have in the lab). These devices can have different analysis software installed so that they can be used for simple ound level readings (e.g. the one on the right), or more complex measuremenst such as 1/3-octave spectrum analysis (as shown on the one on the left).
|
Class 2 SLMs:
- Tolerances of between 1.4 to 5.6 dB over the frequency range 12.5 Hz to 8 kHz (+/- 1.4 dB at 1 kHz)
- Can be used for day to day checking of free-field sound levels, but not calibration
- Fixed microphone that cannot be changed for another type
- More limited range of settings, generally limited to dB(A) and dB(C) and Fast, Slow and Impulse time settings.
(so called Class 3 SLMs are not included in the above mentioned standard and are really just sound level indicators rather than measurement devices)
Below are two examples of Class 2 sound level meters:
|
Figure 6 - examples of class 2 SLMs
|
|
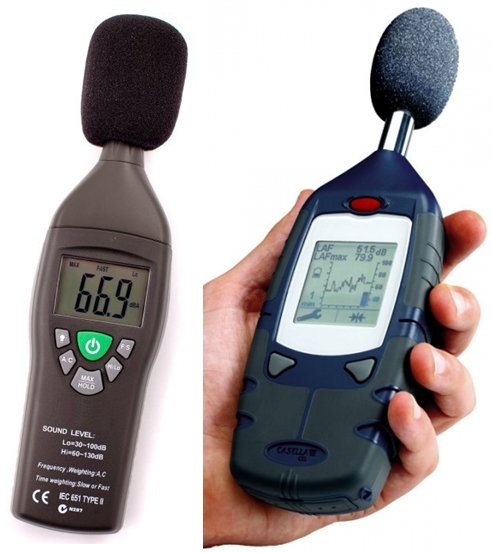
Figure 6 - two examples of class 2 SLMs. The one on the left is an extremely cheap model that can be bought for less than £50 - I have my doubts as to whether it fully conforms to the standards. The one on th eright is a professional quality class 2 SLM (the type we use in the lab).
|
Frequency Weightings in SLMs
The three most important frequency weightings that we see on SLMs are dB(Z) or linear; dB(A) and dB(C)
dB(Z) - linear: this is a flat frequency response so that if a single sound level is being measured then all frequencies going into the microphone are weighted equally (even if they are outside the range of human hearing). It is this setting that should be used for calibration of audiometric equipment.
dB(A) and dB(C): the human auditory system does not have a flat frequency response and this can be shown by measuring equal loudness contours (ELCs) where listeners are asked to match the level of ounds of different frequencies to a reference at 1kHz. If this is done at a range of levels we see that the auditory system has a flatter frequency response at higher levels than at low. The dB(A) and dB(C) settings are designed to take this variation in sensitivity into account. A measurement in dB(A) will filter out low frequencies to try to mimic the frequency response of the auditory system. The dB(A) setting is designed to mimic the 40-phon ELC (i.e. when sounds are matched to a 1 kHz reference tone at 40 dB SPL. The dB(C) setting is designed to mimic the 100-phon ELC (i.e. when sounds are matched to a 1 kHz reference tone at 100 dB SPL. Thus the dB(C) weighting is flatter than the dB(A). Class 2 sound level meters typically only have the dB(A) and dB(C) settings and so if a 'flat' weighting is required the dB(C) should be used, or better still get a Class 1 SLM.
The following graph shows a set of equal-loudness contours for normal hearing listeners, the 40-phon contour is highlighted.
|
Figure 7 - equal loudness contours
|
|
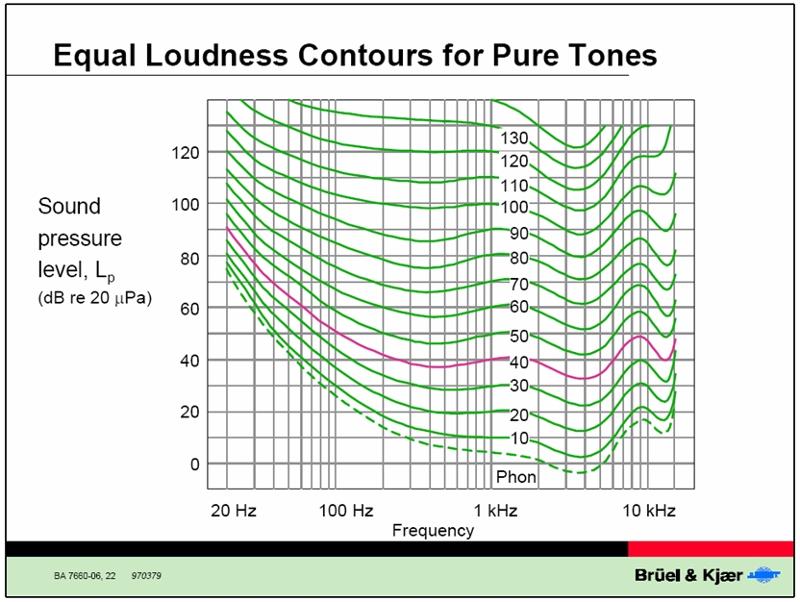
Figure 7 - plot of frequency/threshold curve for minimum audible field (dashed line) plus equal loudness countours measured at different reference levels. The 40 phon ELC is the one on which the 'A-weighting' for SLMs is based. The key point here is that this curve reflects a decrease in sensitivity of the ear towards lower and higher frequencies. The 'C-weighting' is based on the flatter 100-phon equal loudness contour.
|
If the 40-phon and 100-phon equal loudness countours are turned upside down and smoothed (and set to 0dB attenduation at 1kHz) the the dB(A) and dB(C) weightings are produced. The following graph shows these (and other) weightings.
|
Figure 8 - Frequency weighting curves used in SLMs
|
|
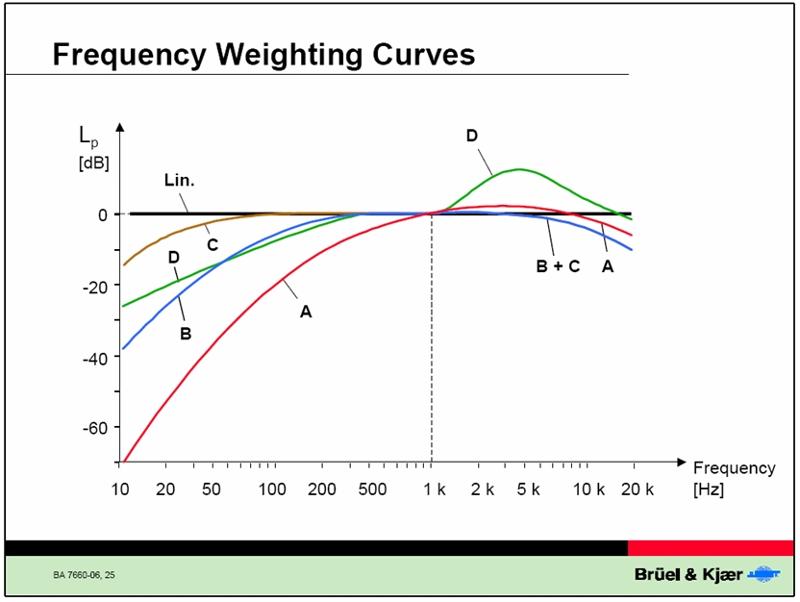
Figure 8 - different frequency weighting curves used in th emeasurement of sound. In SLMs the commonly used ones are A, C and Linear (also referred to as Z). dB SPL(A) is typically used to measure sound at moderate levels (e.g. background noise in a room). dB SPL(C) is more typically used for the measurement of high-level sounds.
|
Time Weightings for SLMs
In addition to the frequency weightings SLMs also have time-weightings. These settings determine the time period over which the rms signal level is calculated (i.e. averaging or smooting time). There are three settings used on most SLMs:
- Fast: 125ms averaging time
- Slow: 1000ms averaging time
- Impulse: 35ms averaging time (designed to catch sudden peaks in the signal, often associated with some sort of capture-hold and reset mechanism - cannot be used for calibration of transient signes though, see later).
With the fast and slow setting, the choice of whcih to use depends on the signal - obviously the slow setting will average more, but it will also take a lot longer to settle to changes in the signal.
Standards relating to and defining their performance of SLMs
- BS EN 61672-1:2013 Electroacoustics. Sound level meters (part 1 - specifications)
- BS EN 61672-2:2013 Electroacoustics. Sound level meters (part 2 - pattern evaluation tests)
- BS EN 61672-3:2013 Electroacoustics. Sound level meters. Periodic tests
Audiometer Calibration - Pure-tone air-conduction with supra-aural headphones.
(Presentation at bottom of page)
Equipment
For this calibration procedure basic requirements would be:
- Pure-tone audiometer with headphones (TDH39/49 used in this example) - make sure that it is all working and that you get the expected sound out of the correct earphone
- Class 1 sound level meter
- Sound level calibrator (or pistonphone)
- Appropriate coupler (Ear simulator - BS EN 60318-1; or 6cc coupler - BS EN 60318-3)
- RETSPL values for the appropriate coupler and headphone combination (BS EN ISO 389-1)
(references given below)
Expected Values
Once the equipment is assembled and the calibration of the SLM checked (see presentation) you need to calculate what dB SPL you could expect to get given what you set the audiometer dial to. Remember that the RETSPL is the number of dB SPL that you would expect with that coupler/headphone combination for 0 dB HL.
To ensure a good signal-noise ratio we set the audiometer to 70 dB HL
If we are using TDH39 Headphones and a Ear simulator (BS EN 60318-1) then the RETSPL values are given in the table below:
|
Table 1 - Example RETSPL values
|
|
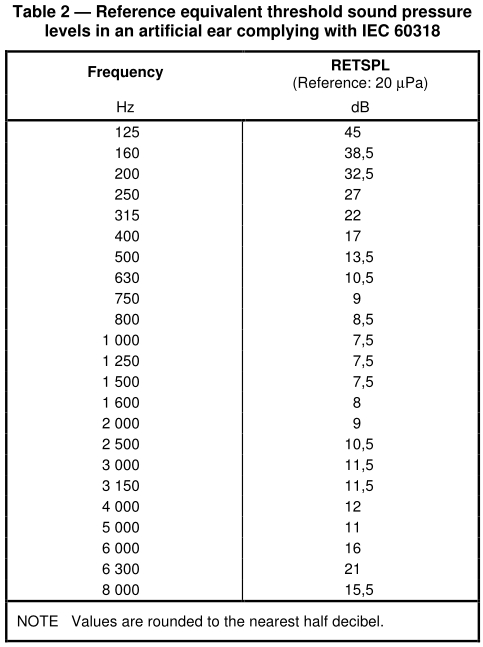
Table 1 - RETSPL values for supra-aural sounds measured using an artificial ear that complies with BS EN 60318-1. This table gives the value in dB SPL at each frequency that corresponds to 0 dB HL (measured with this coupler). Thus, at 1000Hz, 0 dB HL on the audiometer dial should produce 7.5 dB SPL (if we could measure at levels this low).
|
So we know that 0dB HL at 1kHz corresponds to 7.5 dB SPL, thus for a dial reading of 70 dB HL we would expect 77.5 dB SPL
Or at 125 Hz for a dial of 70 dB HL we would expect 115 dB SPL. Because of the range of levels across frequency we may find that we have to change the range setting on the SLM.
Procedure
Now that we have the equipment set up and we know what values we should be getting we can make the measurements.
- Set up equipment
- Set SLM to dB(Z) or linear frequency response
- Check sensitivity of SLM with sound level calibrator
- Set Audiometer to 70 dB HL (can use 60 dB HL, but would need to adjust expected values)
- Listen to Audiometer to make sure signal is OK
- Place earphone centrally on coupler with 4.5N force applied
- Measure sound level on SLM
- Compare measured reading with expected
- Change frequency and repeat measurements (repeat for other earphone)
- If readings more that 3.7 dB (125Hz-4kHz; 6.2 dB up to 8 kHz BS EN 60646-1:2015) apart then audiometer needs adjusting
Sources of Error
Asuming calibration was OK – some examples from past practical sessions:
- No signal – equipment not set up correctly (e.g. wrong earpiece on coupler, wrong channel selected, broken cables or equipment …, not turned on!)
- Signal audible but reading way too low:
- Damaged headphones
- Headphones not positioned correctly
- Wrong filter settings on measurement system (e.g. A-weighting selected, or peak on spectrum analyser not selected)
- External noises influencing measurements
- Make sure that you listen at the same time as making the measurements – can you hear extraneous noises, even if they are outside the room?
- Are you making extraneous noise – do you have your hands on the table? Are you talking?
- Is your mobile phone interfering with the equipment (even if it isn't ringing!)?
References
- BS EN 60318-1:2009 Electroacoustics. Simulators of human head and ear. Part 1: Ear simulator for the measurement of supra-aural and circumaural earphones
- BS EN 60318-3:2015 Electroacoustics. Simulators of human head and ear. Part 3: Acoustic coupler for the calibration of supra-aural earphones used in audiometry
- BS EN ISO 389-1:2013 Acoustics. Reference zero for the calibration of audiometric equipment - Part 1: Reference equivalent threshold sound pressure levels for pure tones and supra-aural earphones
Calibration of Audiometer - Pure-tone air conduction with Insert Earphones.
Equipment
For this calibration procedure basic requirements would be:
- Pure-tone audiometer with inset earphones - make sure that it is all working and that you get the expected sound out of the correct earphone
- Class 1 sound level meter
- Sound level calibrator (or pistonphone)
- Appropriate coupler (2cc coupler: BS EN 60318-5 or 2cc coupler - or occluded ear simulator: BS 6310:1982 or IEC60711, often referred to a 711 coupler)
- RETSPL values for the appropriate coupler and earphone combination (BS EN ISO 389-2)
(references given below)
Here are examples of couplers from different manufacturers - these are similar to those used in hearing-aid test boxes and come with a variety of ways of connecting to transducers - make sure you use the correct one for your insert earphones.
|
Figure 9 - couplers for calibrating insert earphones
|
|
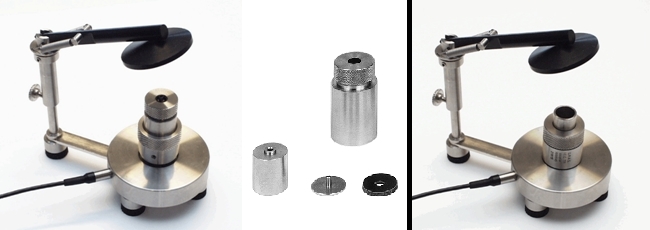
Figure 8 - 2cc couplers (left) and an occluded ear simulator (right; also refered to as IEC711 coupler). The 2cc coupler is the same as those used in hearing aid test boxes and has different attachments for coupling transducers in different ways (the occluded ear simulator can also have differentattachements and the one illustrated is for the foam tip of an insert earphone).
|
Expected Values - RETSPLs
Once the equipment is assembled and the calibration of the SLM checked (see presentation) you need to calculate what dB SPL you could expect to get given what you set the audiometer dial to. Remember that the RETSPL is the number of dB SPL that you would expect with that coupler/headphone combination for 0 dB HL.
To ensure a good signal-noise ratio we set the audiometer to 70 dB HL
If we are using insert earphones and a IEC711 coupler (BS 6310:1982 or IEC60711) then the RETSPL values are given in the table below:
|
Table 2 - RETSPL values for insert earphones
|
|
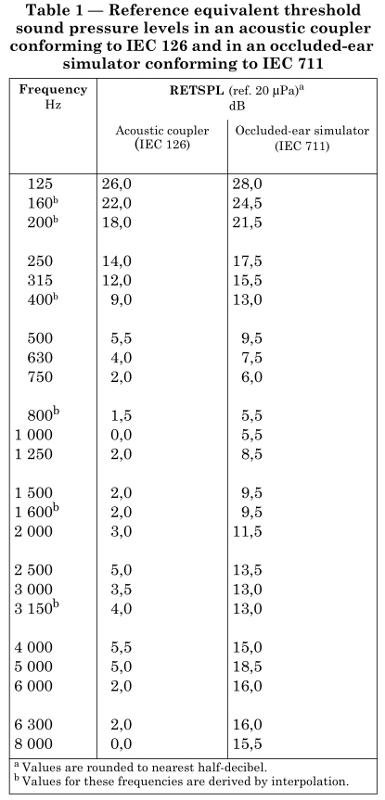
Table 2 - RETSPL values for insert earphones measured on the two different couplers. Notice that the biggest differences between the two is at the higher frequencies where the occluded ear simulator is designed to more accurately mimic the acoustic impedance of a real ear.
|
So we know that 0dB HL at 1kHz corresponds to 5.5 dB SPL, thus for a dial reading of 70 dB HL we would expect 75.5 dB SPL
Or at 125 Hz for a dial of 70 dB HL we would expect 98 dB SPL. Because of the range of levels across frequency we may find that we have to change the range setting on the SLM.
Procedure
Now that we have the equipment set up and we know what values we should be getting we can make the measurements.
- Set up equipment
- Set SLM to dB(Z) or linear frequency response
- Check sensitivity of SLM with sound level calibrator
- Set Audiometer to 70 dB HL (can use 60 dB HL, but would need to adjust expected values)
- Listen to Audiometer to make sure signal is OK
- Connect insert earphone to coupler
- Measure sound level on SLM
- Compare measured reading with expected
- Change frequency and repeat measurements (repeat for other earphone)
- If readings more that 3dB apart then audiometer needs adjusting
References
- BS EN ISO 389-2:1997 Acoustics. Reference zero for the calibration of audiometric equipment - Part 2: Reference equivalent threshold sound pressure levels for pure tones and insert earphones
- BS EN 60318-4:2010 Electroacoustics. Simulators of human head and ear - Part 4: Occluded-ear simulator for the measurement of earphones coupled to the ear by means of ear inserts
- BS EN 60318-5:2006 Electroacoustics. Simulators of human head and ear. 2 cm3 coupler for the measurement of hearing aids and earphones coupled to the ear by means of ear inserts
Calibrating the masking signal
The procedure for calibrating the masking signal on audiometers is virtually identical to that of the pure-tone procedures described previously for either supra-aural or insert earphones. Apart from three aspects:
- The narrow band masking noise is a fluctuating signal so some sort of averaging on the sound level meter is advisable (e.g. setting it to 'slow'), however if you are going to do this you need to ensure that the signal is on for the duration of the averaging.
- The masker usually comes out of the opposite ear-phone to that of the pure-tone so make sure you are measuring the correct ear.
- The level of narrow band noise required to mask a pure tone is usually a few dB above the level of the tone itself so you in order to calibrate the level of the masker to 0 dB effective masking level you need to add an appropriate adjustment to the equivalent level of tone.
So, if the audiometer produces a 1/3 octave masking noise you need to look up this correction factor in BS EN ISO 389-4 (see table below) and add it to the level of the tone i.e.:
dB HL (audiometer dial) + RETSPL = expected level of tone
dB HL (audiometer dial) + RETSPL + Reference level for narrowband masking noise = expected level of masker for 0dB effective masking
So for a 1kHz tone we might have:
70 dB HL + 7.5 dB = 77.5 dB SPL (expected level of tone)
For the masker:
70 dB HL + 7.5 dB + 6dB = 83.5 dB SPL
Reference levels for narrow-band masking noise (from BS EN ISO 389-4 - it is the 1/3 octave column we need to take)
|
Table 3 - Reference levels for narrow band masking noise
|
|
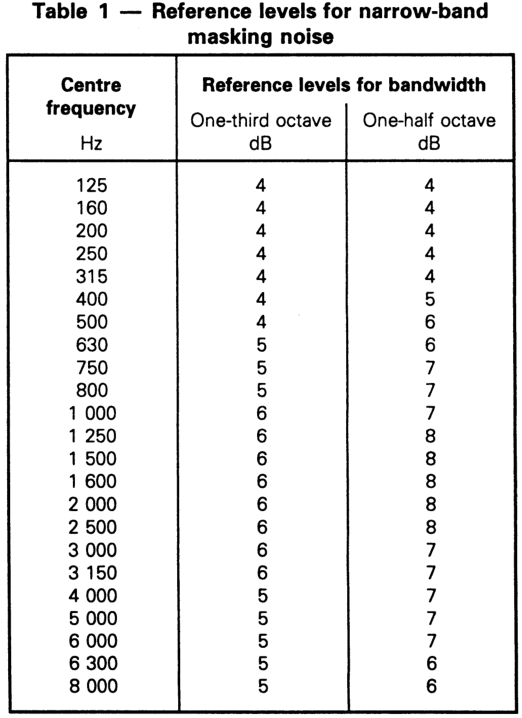
Table 1 - Reference values for narrow-band masking noises that need to be added to the RETSPL values to give the appropriately calibrated level of masker on the audiometer
|
References
- BS EN ISO 389-4:1999 Acoustics. Reference zero for the calibration of audiometric equipment - Part 4: Reference levels for narrow-band masking noise
Bone Conduction Calibration
The same basic principles apply to BC calibration as they do to AC calibration apart from a few aspects:
- Force level rather than sound level is what is measured
- The artificial mastoid is more temperature sensitive than the artificial ears
- The audiometer dial level used has to be lower (e.g. 40 dB HL)
- The calibration procedure needs to take into account the sensitivity of the artificial mastoid.
Procedure
As with AC calibration the basic principle is that the audiometer playes a signal through the transducer and this is measured on a coupler, in this case an artificial mastoid. The artificial mastoid has a sensor under a 'rubber' dome that picks up the vibratory force applied by the bone-vibrator. The signal from this sensor is then passed to the sound level meter and a reading can be made. The figure below shows an example of an artificial mastoid.
|
Figure 10 - Example of an artificial mastoid
|
|
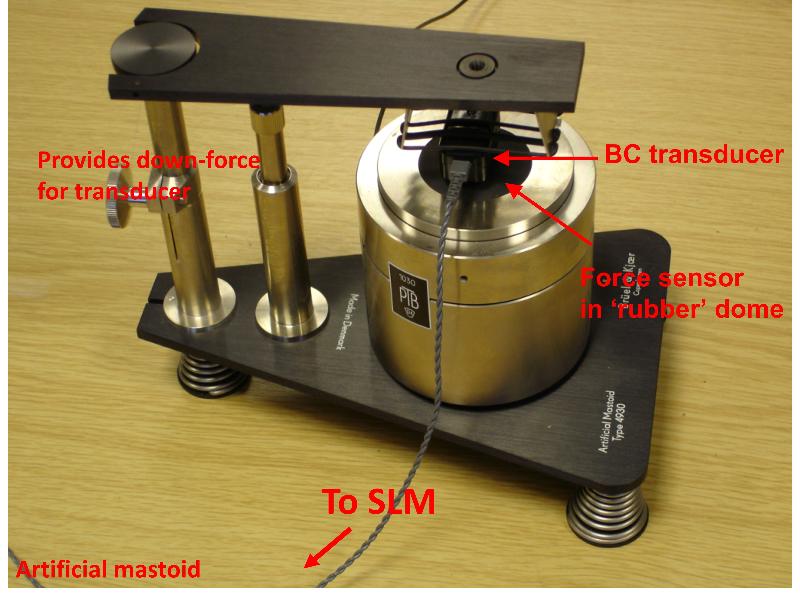
Figure 10 - Example of an artificial mastoid with a bone-conduction transducer paced on the vibration sensing 'rubber' dome.
|
The output of the mastoid (displayed on the SLM) is then compared with what we should expect. However, it is this expected value that is slightly more complex then for AC calibration. In AC calibration we can use the sound level calibrator to check that the mearurement system is giving the correct reading. Without specialist equipment we can't do this for bone conduction we have to rely on (a) the manufacturers (or other) calibration certificate for the artificial mastoid, and (b) that the sensitivity of the SLM is correct for the particular voltage into the SLM. This is because the artificial mastoid gives a particular voltage for a particular force level applied to the sensor - we need to know this sensitivity so that we can equate the voltage out of the mastoid with a force going in. However, in order to measure the voltage coming out, we also need to know what voltage going into the SLM gives a particular reading. So for example:
- The sensitivity of the mastoid at 1kHz might be: 102dB re 1μV/N, this means that if 1N force is applied to the mastoid, then the output of the mastoid would be 102 dB greater than 1μV.
- The sensitivity of the SLM might be: 0dB re 1μV, this means that if 1μV voltage goes into the SLM, then the dial reading would be 0dB
These two aspects need to be taken into account in the calculation of what value we would expect on the SLM. The following describes the stages in this calculation.
- The standard (BS EN ISO 389-3:1999) specifies the Reference Equivalent Threshold Force Level (RETFL) (42.5 dB re 1μN) i.e. for otologically normal young adults the force corresponding to 0 dB HL should be 42.5 dB greater than 1μN. At this point it may helpful to express this in dB re. 1N, depending on how the sensitivity of the mastoid is presented - for this example 42.5 dB re 1μN = -77.5 dB re 1N.
- We next need to obtain the sensitivity of the mastoid from the calibration sheet (typically expressed in 1μV/N) - this might be, for example 102dB re 1μV/N.
- Next we need to combine these two to get the voltage from the mastoid that we would expect if a force corresponding to the RETFL value was applied to the mastoid. This is simply the RETFL (in appropriate units) plus the sensitivity of the mastoid. In this case: -77.5 dB re 1N + 102 dB re 1μV/N = 24.5 dB re. 1μV.
- In other words, if the audiometer dial was set to 0 dB HL we would expect a voltage out of the mastoid of 24.5 dB re. 1μV
- So, we know what voltage we expect for 0 dB HL, we could measure this in an oscilloscope, but more usually the mastoid is connected to an SLM in which case we need to know what voltage going into the the SLM corresponds to zero dB on the display (i.e. the sensitivity of the SLM - in this example we will assume it is 1μV for 0dB.
- The output of the mastoid for the applied RETFL value in this example is 24.5 dB re. 1μV and the sensitivity of the SLM is 1μV for 0dB so if we set the audiometer dial to 0dB HL the expected reading on the SLM would be 24.5 dB (please note that this is not dB SPL, strictly speaking it is in units of dB re. 1μV).
So, to summarise:
RETFL (dB re 1N) + mastoid sensitivity (dB re 1μV/N) +SLM sensitivity (dB re. 1μV) = expected value for 0dB HL
So for our example:
-77.5 dB re 1N + 102 dB re 1μV/N + 0dB re. 1μV = 24.5 dB re. 1μV
But remember we set the audiometer dial to 40 dB HL to get a good signal to noise ratio, so we need to add 40 dB to this value i.e. 64.5 dB re. 1μV. That is, for 1kHz, with this mastoid, for a 40dB dial setting we would expect a reading of 64.5 dB on the SLM. We can then compare this to the measured SLM reading and make sure that they are within 3dB of each other.
The table below gives an example set of values for the range of frequencies:
|
Table 4 - example calculation of the required SLM reading corresponding to 0 dB HL for BC
|
|
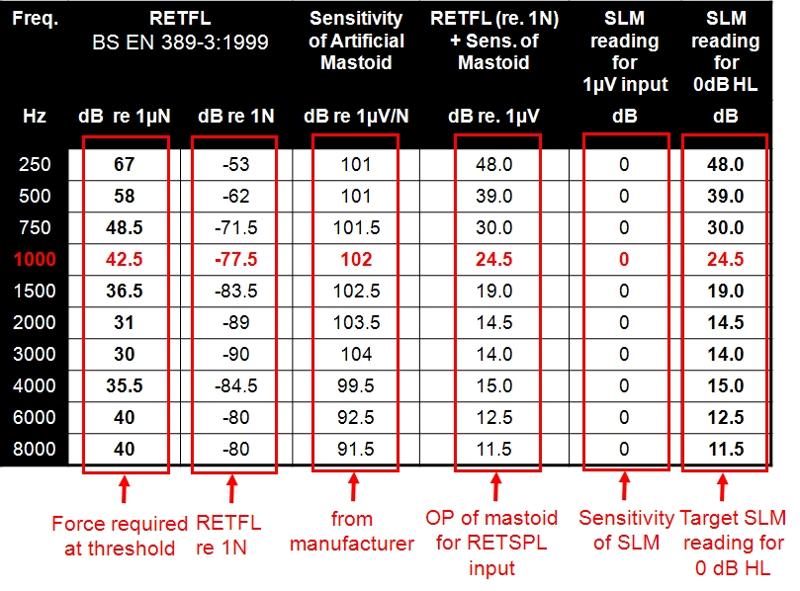
Table 4 - Example calculations of the expected SLM reading that should correspond to 0 dB HL for bone-conduction. The first two columns are the equivalent of the RETSPL values for BC. The difference is that for AC we can calibrate the measurement system so that we know exactly what we are getting in dB SPL. With BC, the sensitivity of the artificial mastoid varies from device to device and we don't have the equivalent of a sound level calibrator to check this so we need to rely on the manufacturers sensitivity values (column 3),or those of provided by accredited calibration institution who has the specialist equipment to do calibrate the mastoid. Column 4 then combines columns 2 and 3 to give the voltage (in dB) out of the mastoid that should correspond to 0 dB HL. If 1μV into the SLM gives a reading of 0dB then the 4th and 6th column should read the same.
|
Cautions
Because of the nature of the artificial mastoid it is very temperature sensitive and so needs to have had plenty of time to adjust to the temperature of the room before being used.
Care must be taken to centre the bone conductor on the center of the 'rubber' dome
The audiometer must be set at a level for a good enough signal to noise ratio, but one that won't produce significant distortion.
References
BS EN ISO 389-3:1999 Acoustics. Reference zero for the calibration of audiometric equipment - Part 3: Reference equivalent threshold force levels for pure tones and bone vibrators
Short Duration Signals
In this section we will look at how we can calibrate signals of short duration. The basic issues is that Sound Level meters are not able to accurately capture and measure transient signals such as those used in OAEs or ABRs etc. Such signals are short duration but repetitive and thus the SLM will also capture persiods of silence between the stimuli which will then be included within the averaging period of the SLM.
Peak-equivalent SPL (dB pe SPL)
To get round this problem we need a signal that is comparable to the transient that we are able to measure on the SLM. The signal we use is a sinusoid, and we equate it to the transient signal's peak-to-peak amplitude. That is, we set the sinusoid to have the same peak-to-peak amplitude as the transient signal and then measure the dB SPL of the sinusoid. So for example, if our we set the sinusoid to be the same amplitude as a click and the sinusoid measures 100 dB SPL then we can say the click has a level of 100 dB pe SPL. For a click stimulus we would compare it with a sinusoid of 1000 Hz, whereas for a tone-pip we would set the sinusoid to the same frequency as the tone-pip.
The figure below shows the basic principle.
|
Figure 11 - illustration of peak equivalence
|
|
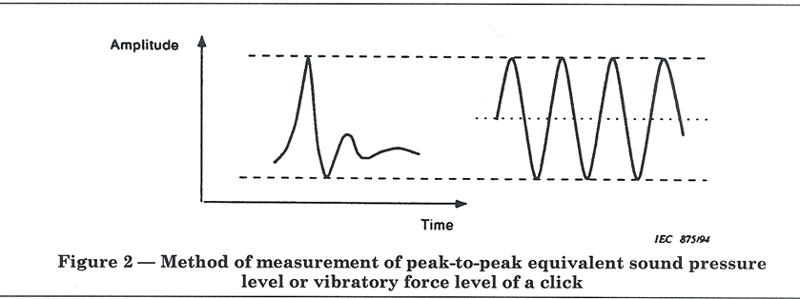
Figure 11 - illustration of what is meant by peak-equivalence. The basic principle is that the transient signal is captured on an oscilloscope and then a pure-tone is then produced with the same peak-to-peak amplitude and the dB SPL of the pure-tone is then measured on an SLM.
|
Procedure
The basic measurement setup is the same for PTA calibration, sound from the ABR (or whaterver) machine is played through the headphones into the appropiate coupler connected to a sound level meter. However, as we also need to capture the waveform we take the electrical output from the SLM and feed it into an oscilloscope so that we can capture the waveform. Once the transient waveform is captured on the oscilloscope we measure the peak-to-peak voltage on the oscilloscope. We then play a sinusoid of the appropiate frequency and adjust the level of the sinusoid until it gives the same peak-to-peak amplitude on the oscilloscope. No that the two signals are equated in amplitude we can measure the dB SPL of the sinusoid on the SLM to get the dB pe SPL of the transient signal.
RETSPL Values
Whilst pure-tone signals are easily defined, transient signals can be of varying duration and repetition rate, and for tone-pips the rise and fall time can also vary. In order to try to standardise tehse signals BS EN 60645-3 has been produced which specifies waveform shapes and durations for such signals. For example the standard specifies a click of 100μS duration (for further details see standard).
|
Figure 12 - examples of 'standard transient signals'
|
|
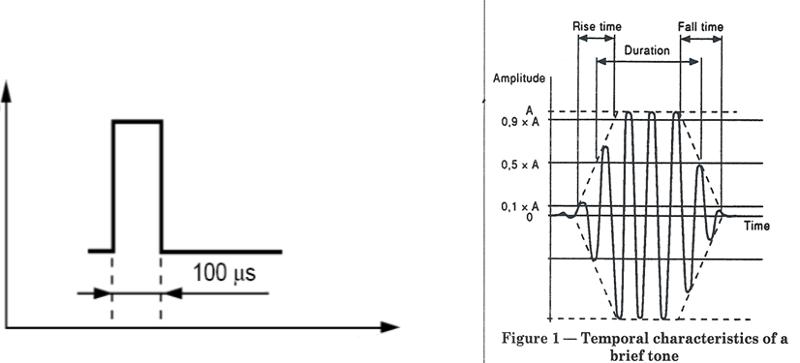
Figure 12 - Left: a 'standard click' which has a rectangular electrical pulse going into the transducer with a duration of 100μS (use of a shorter or longer duration will result in different amounts of energy and hence different threshold. Right: a 'standard tone-pip' which has a specific shape and duration (defined in terms of the number of cycles of the waveform in the rise, flar, and fall reagions of the waveform), again, difference from this standard will alter the measured thresholds and thus the RETSPL values will not be valid.
|
If the stimulus used conforms to this standard then BS EN ISO 389-6:2007 can also be used to provide RETSPL values for these signals. However, it is important to understand that these RETSPL valuse only apply to specific conditions. That is, they are transducer and coupler specific and are for specific durations of stimulus and repetition rates. This is because threshold for these stimuli varies with repetition rates. The following table is an extract from this standard.
|
Table 5 - peRETSPL values for standard clicks
|
|
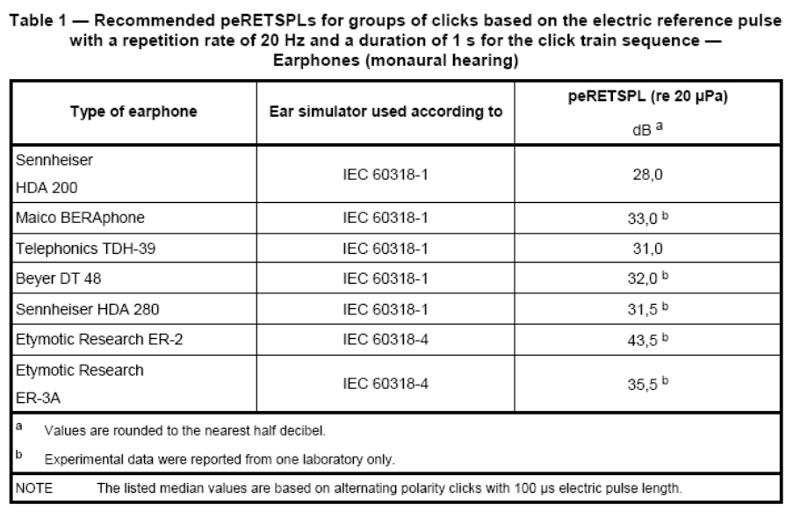
Table 5 - peRETSPL values for standard clicks presented at 20Hz for a duration of 1s. Thus for ER-3A insert earphones 0 dB HL will correspond to 35.5 dB peSPL.
|
The standard also gives RETSPL values for tone-pips. It is important to note that these peRETSPL values are for behavioural thresholds. Because of this, care must be taken in interpreting other measures (e.g. ABR thresholds) specified in dB HL. It is also important to note that changes in the repetition rate of the clicks will affect the threshold values (higher rates contain more energy and thus produce lower thresholds) - the standard gives correction factors for different repetition rates between 10-100Hz.
dB nHL
If the stimulus being used does not conform to BS EN 60645-3 then it is important to obtain local 'normal hearing' standards. For this, the basic principle is that ABR (or cortical etc) thresholds are measured 30 or so normal hearing young adults and the median electrophysiological threshold is then taken as being "normal" (i.e. 0 dB nHL) all other measurements are then expressed relative to this.
References
BS EN 60645-3:2020 Electroacoustics. Audiometric equipment. Test signals of short duration
BS EN ISO 389-6:2007 Acoustics. Reference zero for the calibration of audiometric equipment. Reference threshold of hearing for test signals of short duration
Calibration of Hearing Aid Test Boxes
One simple way of checking a hearing aid test box is to remove the coupler and check that the measured output is what it should be! If you don't get sensible results it needs calibrating (assuming there is nothing else obviously wrong). This checking process involves removing the coupler from the measurement microphone and putting it next to the reference/control microphone. The lid is then closed and a then whatever signal you select should give the expected reading on the screen. For example a 65dB SPL pure-tone should give a single point on the screen at 65 dB SPL of the chosen frequency. If a tone-sweep is selected then a flat line at the appropriate level should be produced. It is adviseable to carry out such a check on a daily basis if test box measurements are used.
A simple check of test-boxes
|
Figure 13 - example of a simple test-box check
|
|
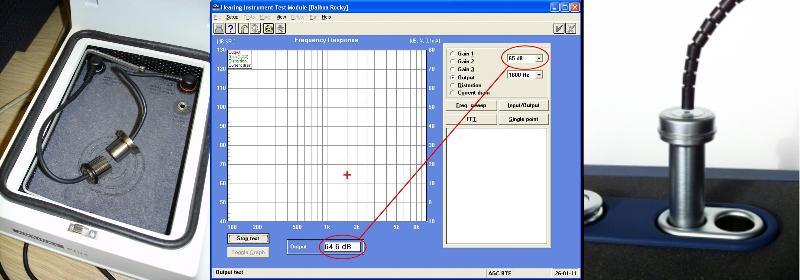
Figure 13 - Checking a test box. The 2cc coupler is removed from the measurement microphone and the two microphones placed close together (left for Aurical I; right for Audical II). The lid is then closed and a signal played out. In this example a 1600Hz tone at 65 dB SPL is selected and the measured signal comes out at 64.6 dB SPL in this example - close enough! If a tone-sweep is selecetd then a flat line o fth ecorrect level should be displayed. If the reading is at an incorrect level then calibration/adjustment is needed. Please note that this procedure is described in the manual fo rthe Aurical II test box.
|
Test box calibration
If the above checks show that the test box is not giving the correct reading, or the time has come for a more calibration then a similar procedure is used for calibrating a sound level meter. The actual procedure and menus used will depend on the test box. Some equipment will require special codes to enter the calibration menus of the software. Full test-box calibration is typically not accessible for users and the recommendations are that this is carried out by returning the device to the manufacturer or an accredited calibration service. The figure below shows the basic process for an Aurical I test box.
|
Figure 14 - test box calibration
|
|
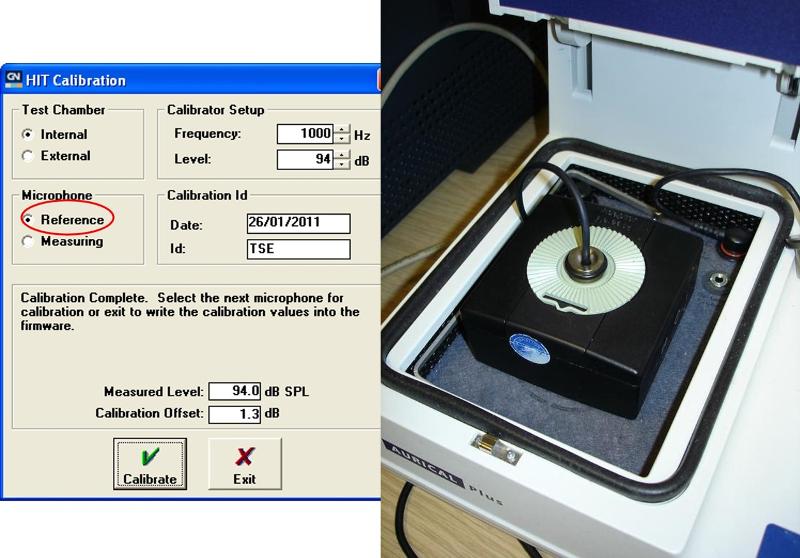
Figure 14 - The test box calibration is a simple process if access to the software menu is granted. This example shows the menu for an Aurical I test box. A sound level calibrator (same as those used for SLMs) is used to present a known signal (e.g. 94 dB SPL at 1kHz) to the selected microphone. The microphone measures ths signal and a desired offset produced to correct for any differences. This is then repeated for the other microphone.
|
Calibration of Tympanometers
The calibration of typanometers is somewhat more complex simply because of the range of different aspects that need calibrating. IN order to understand this complexity it is helpful to recap the basic functionality of a tympanometer. In order to measures admittance of the middle ear a low frequency tone (226Hz*) is delivered through the probe, the signal in the microphone is measured while the air pressure in the ear canal is altered by means of the air pump. The change in the measured probe tone level in the ear canal as pressure is altered gives an indication of the change in the the acoustic admittance of the middle ear. Measurement of acoustic reflexes use the same principles (without the change in pressure) to detect changes in the acoustic admittance of the ear when a 2nd acoustic signal is presented.
*high-frequency or multi-frequency tympanometers may use other frequencies as well – all should be calibrated
In order to fully calibrate a tympanometer there are a range of different measurements that must be made - the different acoustic signal levels must be calibrated as muct the conversion of the probe-tone level to impedance values.Some of the things that need measuing are listed below.
- Probe tone:
- Measure probe tone frequency and level.
- Acoustic reflex activating stimulus signals:
- Measure ipsilateral
- if available, contralateral reflex signal levels
- their frequencies and/or spectral content and rise/fall times.
- Impedance/admittance indicator:
- Measure different volumes
- Air pressure:
- Measure the air pressure range using a pressure measuring system (we won't cover this)
In most modern tympanometers the procedure is described by the manufacturer. In the example here we will use a GSI Tympstar. [For the model used the calibration mode can obly be accessed by opening the machine and changing a switch on the moterboard]. In this device an onscreen menu gives details of the calibration procedure - see figure below.
|
Figure 15 - calibration menu for GSI tympstar
|
|
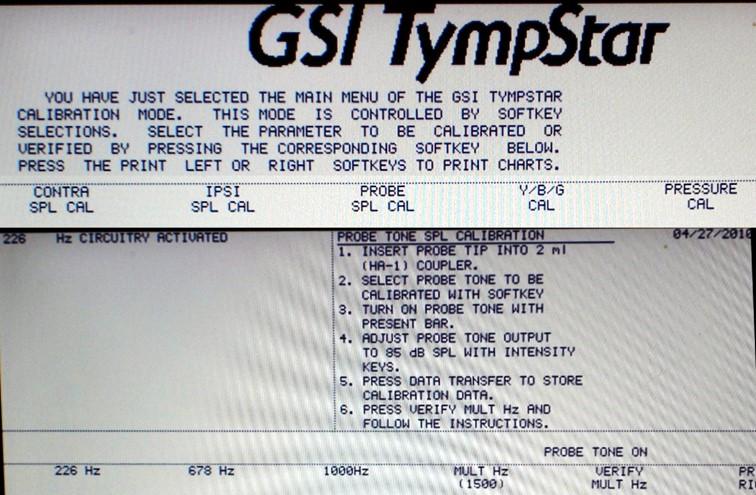
Figure 15 - entering the calibration mode on the GSI Tympstar allows you to select a range of menus which then bring up the details for calibrating that particular aspect. In this example the 'PROBE SPL CAL' menu is showing with instructions on screen and the range of different frequencies that can be selected across the bottom. Similar menus are provided for other signals. Note that the first point on the instructions says insert the probe tip into a 2ml (2cc) coupler.
|
Once the calibration mode is entered the tympanomer can generate the signal to be measured. This signal is measured in a 2cc coupler as shown in the figure below (different adaptors for the coupler are needed depending on the transducer. Note that it is important to disconect the air pipe before putting the probe assembly in the coupler. This is a precaution to prevent any changes in pressure (if you inadvertantly select 'pressure cal') from damaging the microphone.
|
Figure 16 - calibration of acoustic signald from tympanometer
|
|
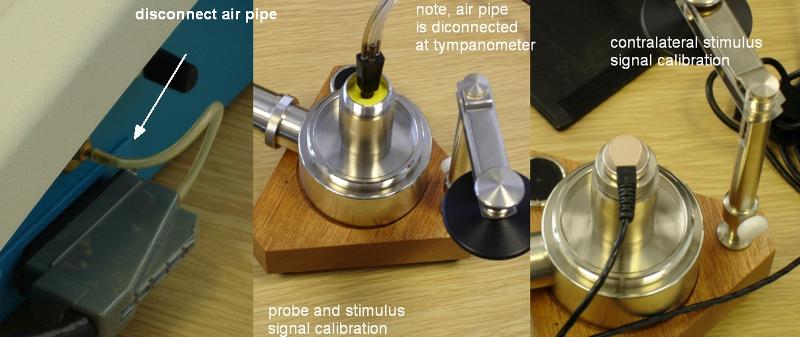
Figure 16 - Attachement of the probe assembly (middle) and contralateral transducer (right) to the 2cc coupler for measuremnet of the acoustic signals. For such measurements disconnection of the air pipe is advised so that the microphone in the coupler isn't damaged by accident.
|
Once the transducer is conencetd to the coupler the signal is selected from the menu and presented. The output is then measured on a sound level meter. This value is then entered in to the tympanometer menu and the inbuilt software adjusts the signal level as approrpoate.
|
Figure 17 - Example of contralateral reflex tone calibration
|
|
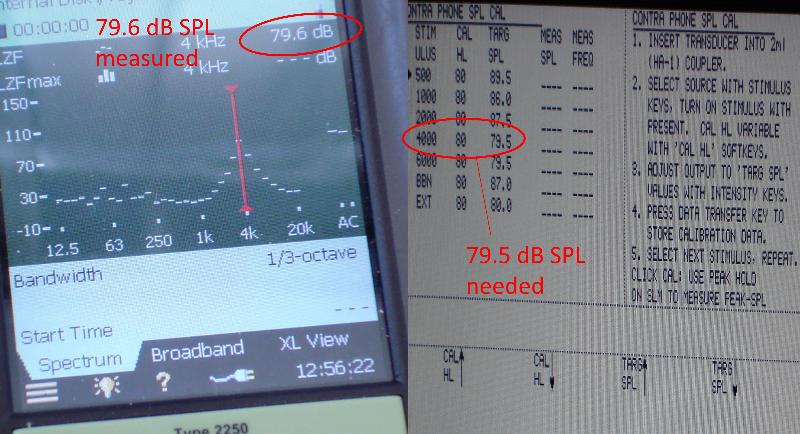
Figure 17 - Following the menu (right) a 4000Hz tone at 80 dB HL should give a measured value of 79.5 dB SPL. The actual measured value in this example is 79.6 dB SPL.
|
After you have calibrated the probe tones the instructions will ask you to calibrate the conversion o fthe probe signals to various components of acoustic impedance. This is done by playing the signals into acoustic cavities of fixed sizes. In the GSI Tympstar three separate components of impedance can be measured:
- Ya – Acoustic Admittance* (the reciprocal of acoustic impedance)
- Ba – Susceptance (imaginary component of complex acoustic admittance)
- Ga – Conductance (real component of complex acoustic admittance )
* Admittance is a vector quantity that can be broken down into 2 components – real and imaginary - one way of thinking about these are as 2 measurements that have a 90 degree difference in phase)
|
Figure 18 - YBG calibration
|
|
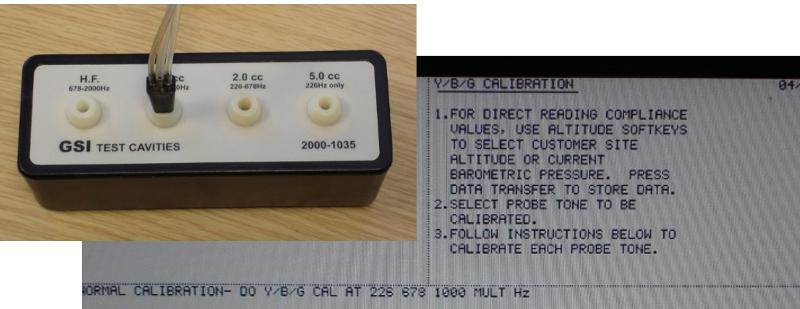
Figure 18 - For YBG calibration the set of test cavities provided by the manufacturer are used, the probe is inserted into these in turn and the signal played as appropriate (according to the instructions given). It is this process that enable the tympanometer to accurately measure things like ear canal volume as well as the YBG components.
|
Maximum Background Noise Levels in Audiometry
Whilst not strictly calibration, one of the key factors in carrying out pure-tone audiometry is the level of background noise in the audiometry room/booth. If this background noise level is too high then the tresholds will be artificially high. Because of this maximum levels of background noise for PTA are specified in standards. To assess this the background noise should be measured using a type 1 SLM with a filter so that you can measure 1/3rd octave bands of noise.These should be measured with the SLM set to Lmax (i.e. measuring peak values, not RMS). The table below gives the maximum allowable sound level in each 1/3rd octave band.
|
Figure 19 - Maximum background noise levels for PTA
|
|
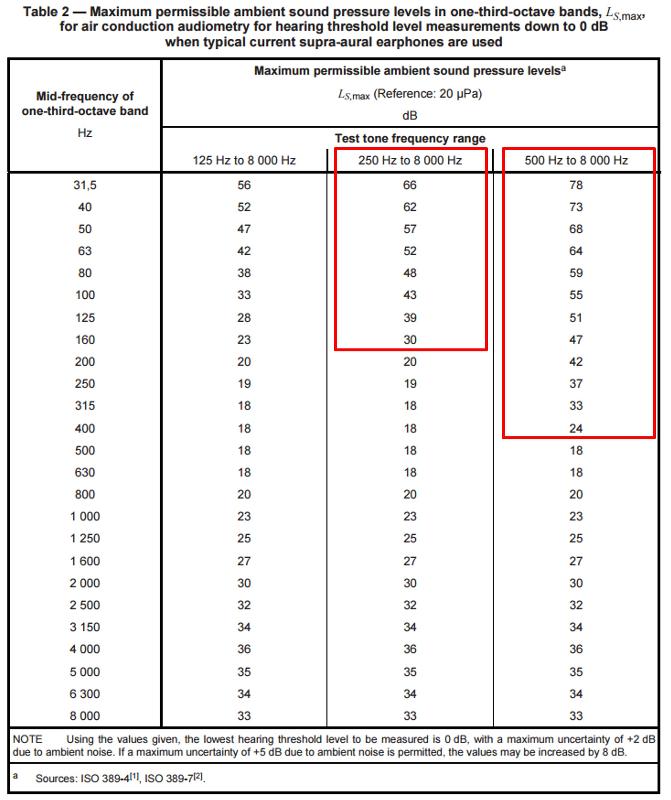
Figure 19 - Maximum 1/3rd octave sound levels for air conduction audiometry using supra-aural headphones (from BS EN ISO 8253-1)> the three columns show values that differ in th elow frequencies depending on the range of low frequencies to be used. For example the right-hand column gives values when PTA is only carried out above 500Hz, the lower frequency values can be relaxed in this case (those within the red boxes).
|
|
Figure 20 - Maximum background noise levels for AC and BC PTA
|
|
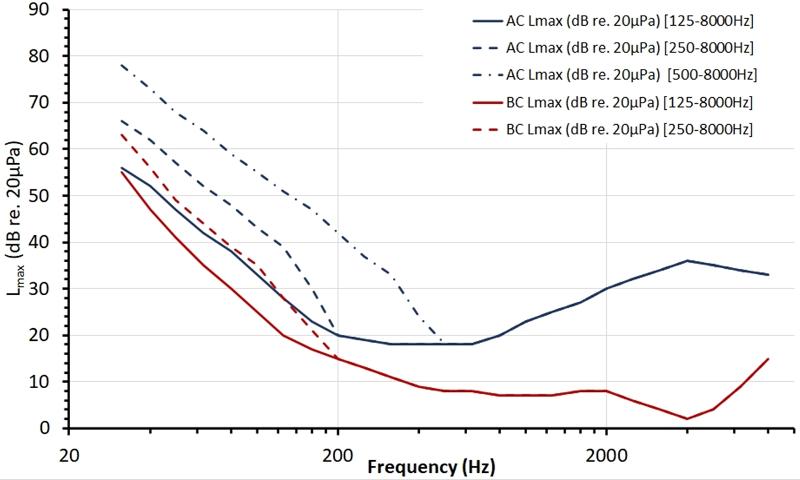
Figure 20 - maximum background noise levels for PTA. Note that the maximum levels for BC are significantly lower than those for AC because the ear is not occluded by the headphones. Given that BC threshold are also also more likely to be lower than AC (in conductive losses) it is these values that determine the specification acoustic test booths. For BC, assuming that both ears are un-occluded, then the shape of the curve will be quite similar to that of the minimum audible field for a single ear.
|
For insert earphones there is even more attenuation so the maximum background noise levels can be relaxed slightly. But relaxing it to that for AC means that we can't do BC, so it is the BC level that defines what is clinically useable.
Reference
BS EN ISO 8253-1:2010 Acoustics. Audiometric test methods. Pure-tone air and bone conduction audiometry
Reading
Houghton, P.M. (2002) Acoustics for Audiologists, Academic Press
The only book that covers calibration of Audiological equipment afrom a British/European perspective (i.e. to British Standards)
Silman, S. & Emmer, M.B. (2011) Instrumentation for Audiology and Hearing Science, Plural