Hammersmith Imanet Data File Formats

Marie-Claude Asselin, So-Jin Holohan, Rainer Hinz, Federico Türkheimer

Hammersmith Imanet, Ltd.
Cyclotron Building
Hammersmith Hospital
Du Cane Road
LONDON
W12 0NN
Great Britain

Tel : (+44) 020 8383 3162
Fax : (+44) 020 8383 2029
WWW: http://www.hammersmithimanet.com


Table of contents
  1. Introduction
  2. Scan Information Files (SIF)
  3. IDWC files
  4. IF files


1. Introduction

    This document gives a brief description of the format of data files which are being used at Hammersmith Imanet at the moment. The description given here should help the users of Hammersmith Imanet data and softwareto check their data for consistency, to localise problems associated withthe data and to understand how the data analysis software expects the datatobe stored.
All files are plain text files (ASCII files). Whilst text files are bigger in size than binary data files with the same contents, text files are easier to transfer between various platforms, e.g. big endian (SPARC) and little endian (Intel) machines, and are more easily imported into or exported from a variety of applications, either custom-made or general purpose (e.g. word processors or data bases). The most important advantage of using text files instead of binary files for these data is, from our viewpoint, that every user easily can display and print text files and perform a whole series of simple checks for data consistency, e.g. compare dates and times of scans, count the number of frames or test whether the data appear to be uncalibrated.
            

2.  Scan Information Files (SIF)

SIFs were introduced at Hammersmith Imanet for several reasons:

  1. They represent a scanner independent overview of the most important information for each frame of a dynamic PET scan. They replaced the older LOG files which had a proprietary format, differing between scanners and versions of the ECAT software. To avoid having all software to handle a whole catalogue of different LOG file versions, the SIF standard was introduced. Various scripts (e.g. log2sif) are available to convert (older) LOG files into the SIF described herein after.
  2. The common file format to process dynamic PET images at Hammersmith Imanet is Analyze 7.5 . As opposed to ECAT files, multi volume Analyze files donot maintain temporal information. Therefore a SIF is required alongsidethe Analyze dynamic image files to provide frame start time and frame endtime of every imagevolume.
  3. To perform weighted fits of the PET data to tracer kinetic models, weights are estimated individually for the frames of each study. These estimates are based on the count rate of true events in the field-of-view of the tomograpgh and are assumed to be homogeneous across all regions of the image obtained byfiltered backprojection [for a discussion see: Carson, RE et al .: An approximation formula for the variance of PET region-of-interest values. IEEE Trans. Med. Imag. 12 (1993), pp. 240 - 250]. Therefore the SIFprovides the total number of prompt and delayed coincidences for each frame.

The contents of an example SIF is:

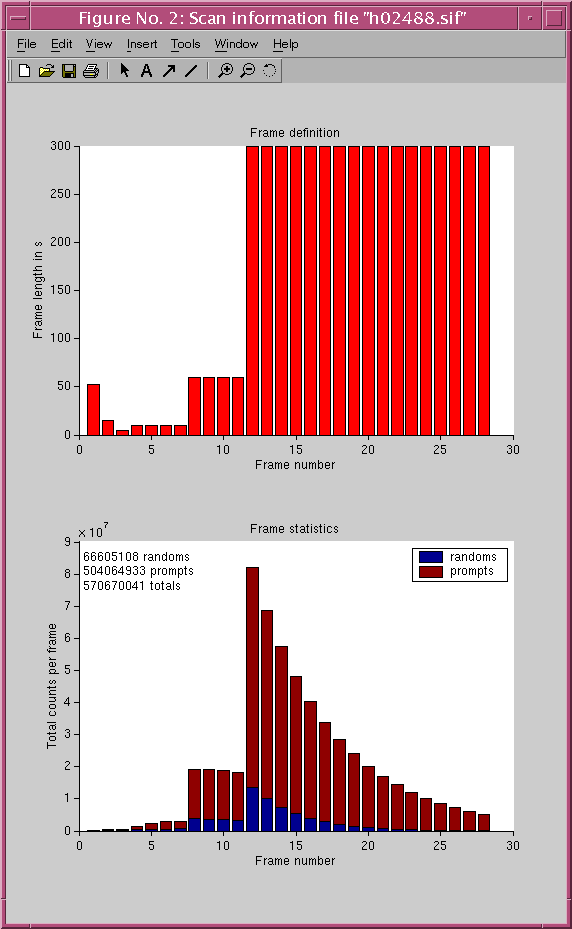
31/1/2002 10:31:01 28 4 2 H02488 C-11
0 52 50617 46859
52 67 328520 206714
67 72 300377 162408
72 82 969573 350407
82 92 1874715 534353
92 102 2324417 618824
102 112 2463107 635273
112 172 15469060 3790914
172 232 15559987 3619122
232 292 15285747 3427281
292 352 14924555 3242744
352 652 68519120 13579865
652 952 58725752 9978332
952 1252 50185206 7300851
1252 1552 42741351 5303428
1552 1852 36406423 3868724
1852 2152 31060365 2812150
2152 2452 26476901 2039700
2452 2752 22567112 1480096
2752 3052 19154336 1066086
3052 3352 16272128 769421
3352 3652 13823059 553101
3652 3952 11744233 397199
3952 4252 9950919 285026
4252 4552 8457570 204345
4552 4852 7214108 149224
4852 5152 6084376 106504
5152 5452 5131299 76157
The first line is the header line. It should contain 7 fields separated by white spaces:
  1. date of the scan (31/1/2002 ) in the format DD/MM/YYYY
  2. scan start time (10:31:01 ) in the format HH:MM:SS
  3. number of frames = number of lines to read after this header line (28) as an integer
  4. number of columns in the data section to read ( 4) as aninteger
  5. version of the scan information file format ( 2) as an integer
  6. scan identification number ( H02488) as a string
  7. isotope (C-11) as a string
In older SIFs (version 1), the header had only the first 5 fields. The scan id andthe isotope code were not provided.

After the header line, the data block follows. It should contain as manylinesas the scan had frames and should have 4 columns:
  1. frame start time in seconds (relative to the scan start time in the header)
  2. frame end time in seconds (relative to the scan start timein the header)
  3. total number of prompt coincidences in the frame (not corrected for radioactive decay)
  4. total number of random coincidences in the frame (not corrected for radioactive decay)
These numbers are normally integers. However, some old scans exist whereframestart times and frame end times were given as floating point numbers.Therefore,the software should be able to handle them as well.
Anything written in the SIF after the number of lines specified in theheader line should be treated as comments.

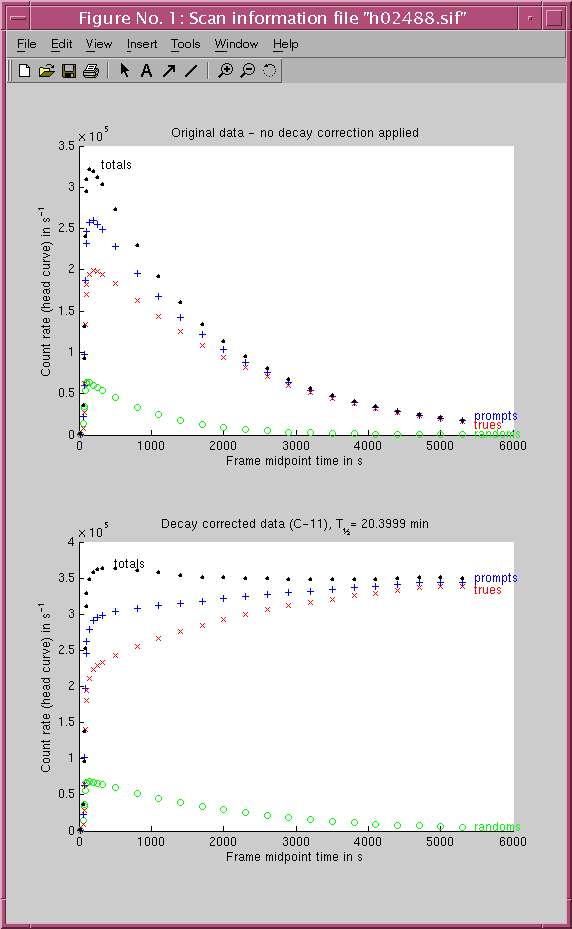
For the example SIF shown above, the following rates of totals, prompts,trues and randoms(per second) are obtained:

count rates frames


3. IDWC files

    At Hammersmith Imanet, IDWC is the default data structurefor fitting all types of non-image data. As examples, IDWC data is createdfor tissue time-activity curves, for time courses of parent fractions inplasma or for the plasma-over-whole blood activity ratio as a function oftime. The acronym IDWC stands for
In most cases, the independent variable is the time. The unit of the time is normally the second s, however, the time does not have to be specified in seconds provided that the software knows about it and handles the data correctly.
For time activity curves, the dependent variable is an activity concentration. The default unit of activity concentration is now generally kilobequerelper cubic centimetre kBq · cm-3. As with the timeasan independent variable, the activity concentration does not have to bespecified in kilobequerels per cubic centimetre. However, it is the user'sresponsibility that the data do not lose precision during input and outputconversationswhen given in ECATcounts or other units which result in numbersorders ofmagnitude different from those of commonly obtained activity concentrationsexpressed in kBq · cm-3.

IDWC files contain IDWC data in text form. The contents of an example IDWC file is:
34
29 0.00194262 2.5 1
65.5 0.197498 0.454485 1
75.5 0.771216 0.0294125 1
83 1.18433 0.0395171 1
93 1.29603 0.0350197 1
103 1.68379 0.032885 1
113 1.53591 0.0316392 1
148 1.71107 0.178779 1
208 1.53267 0.169358 1
268 1.70665 0.163331 1
328 1.76227 0.160366 1
508 1.9327 0.776158 1
808 2.00229 0.754066 1
1108 2.1239 0.735039 1
1408 2.18738 0.726569 1
1708 2.23053 0.720411 1
2008 2.17584 0.718495 1
2308 2.21135 0.723823 1
2608 2.25195 0.731343 1
2908 2.11765 0.741338 1
3208 2.0934 0.75195 1
3508 1.99675 0.765449 1
3808 2.06259 0.778843 1
4108 2.06017 0.795686 1
4408 1.96564 0.812938 1
4708 1.97341 0.829677 1
5008 1.90689 0.851037 1
5308 1.89793 0.869706 1
9300 1.45231 2.42591 1
9900 1.36335 2.58958 1
10500 1.28093 2.75193 1
11100 1.2335 2.92809 1
11700 1.15745 3.11498 1
12300 1.08516 3.3122 1
The first line is a header line. It contains the number of data points (lines) to read from the file after the header line. Anything written in the IDWC file after the number of lines specified in the header line should betreated as comments.

After the header line, the data block follows. It should contain as manylines as specified in the header line and should have between 2 and 4 columns:
  1. the value of the independent variable (time in seconds) as a floating point
  2. the value of the dependent variable as a floating point, e.g. for a time-activity curve the activity concentration in kBq · cm-3
  3. the value of the weight of the data point as a floating point
  4. the code of the data point as an integer
The sample IDWC given above contains a tissue response curve from a dynamic PET study with a total of 34 frames. The values of the independent variable are the frame midpoint times as derived from the SIF of the scan. IDWC data do not have to be contiguous. The first28frames of the shown IDWC are adjacent frames (from 0 s to 5458 s). Thelast6 frames of the shown IDWC are again from a contiguous scan (from 9000s to12600 s).

The first two colums (independent variable and dependent variable) are mandatory for the data block of every IDWC file. The third column (weights) is optional. If it is missing, the software reading IDWC files automatically assigns a uniform weight of 1.0 to every data point of the data set. This would then result in a total sum of the weights equal to the number of data ponintsin the data set.
If user-specified weights are given in an IDWC file, they do not have tobe normalised. However, for consistency with default procedure of assigningweights to the data described in the previous paragraph, it is common practicetonormalise the sum of the weights to the number of data points. In anycase,these relative weights should be chosen such that they match the magnitudeof the data in order to avoid numerical problems in the optimisation procedure.

The fourth and also optional column is populated with an integer value specifying a code. This allows for multiple data sets in one IDWC structure whichmay be required for fitting simultaneously several data sets which shareparameters. Then the code identifies to which data set a data point belongs.If the code column is missing in an IDWC file, the software assumes by defaultthat all data belong to one data set and assignes a code of 1 to every datapoint.

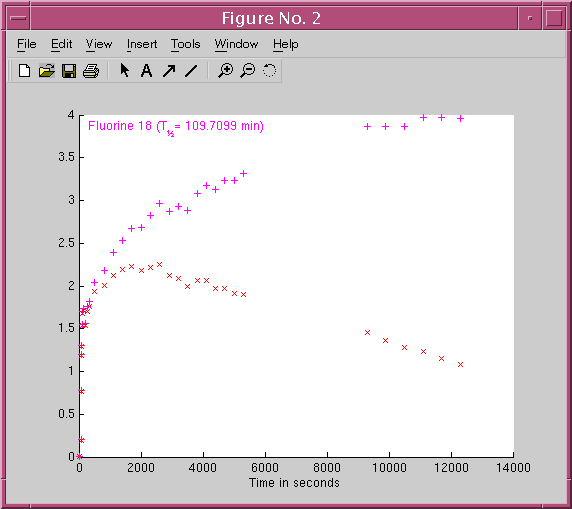
Activity concentration measurements at Hammersmith Imanet are generally given without correcting for radioactive decay. Therefore, the isotope code for IDWC files has to be retrieved from the SIF of the scan. For the example IDWC file shown above, the following twotime-activity curves can be plotted:

IDWC

The raw values from the dependent variable correspond with the red x in the plot. The + signs in magenta of the plot represent the corresponding activity concentrations corrected for the radioactive decay of 18F.

4.  IF files

      Inputf Function files or IF files are used to store input function data required for tracer kinetic modelling. IF files are normally created by blood data processing software, e.g. the older GENIF3 script or the currently used COMIF function of CLICKFIT. Dependent on the tracer, a set of different input functions is generated :
  1. whole blood activity concentration input function (e.g. h02488totalblood.if )
  2. total activity concentration in plasma (e.g. h02488totalplasma.if )
  3. activity concentration in plasma due to the parent (unmetabolised) compound (e.g. h02488parentplasma.if)
  4. activity concentration in plasma due to one or multiple radiolabelled metabolites (e.g. h02488metabplasma.if )
  5. other input functions
All these input functions are saved separately in IF files.

The contents of an example IF file is:
5463
0.167969 0.00537605 0.00757944
1.27344 0.00537482 0.00757944
2.38281 -0.0372675 -0.0525658
3.48828 -0.0372589 -0.0525658
4.59375 -0.0372503 -0.0525658
5.69922 0.0479819 0.0677253
6.80469 -0.0372332 -0.0525658
7.91406 -0.0372245 -0.0525658
9.01953 0.00536615 0.00757944
10.125 0.00536491 0.00757944
: : :
: : :
: : :
: : :
5547 0.0142117 0.0543905
5548 0.0142033 0.0543588
5549 0.014195 0.0543272
5550 0.0141867 0.0542955
5551 0.0141783 0.0542638
5552 0.01417 0.0542322
The first line is a header line. It contains the number of data points (lines) to read from the file after the header line. Anything written in the IF file after the number of lines specified in the header line should be treated as comments.

After the header line, the data block follows. It should contain as many lines as specified in the header line and should have 3 columns:
  1. the time (in seconds)
  2. the activity concentration of the input function as specified by the file name, see examples above  (in kBq · cm-3)
  3. the whole blood activity concentration (in kBq · cm-3)
As discussed for IDWC files, the time does not have to be specified in seconds, and the activity concentration does not have to be in kBq ·cm-3. However, it is the user's responsibility to ensure consistency in the units used to express times and activity concentrations in tissue and in blood and to prove sufficient precision when the floating point numbers are converted during input and output conversion.

Typically, the raw data for input functions are obtained from an online blood detector system [Ranicar, AS et al.:  The on-line monitoring of continuously withdrawn arterial blood during PET studies using a single BGO/photomultiplier assembly and non-stick tubing.  Med. Prog. Technol. 17 (1991), pp. 259 - 264]. Therefore, there is normally one measurement (line) approximately every one second in an IF file, as it can be seen in the upper part of the example IF file.

The vector of times in the IF file must not contain negative times, and all time values must be distinct. When an IF file is read, a data point [0, 0] is implicitly assumed, and then the data are linearly interpolated onto a one second grid. This allows the calculation of convolution integrals of the input function with a fast recursive algorithm.

The whole blood activity concentration is normally included in all IF files in the third column in order to allow for a contribution from the vasculature to the tissue response function.

Activity concentration measurements at Hammersmith Imanet are generally given without correcting for radioactive decay. Hence, also the data in the IF files are decaying data and the isotope code has to be retrieved from the SIF  of the scan..